3.3. Access to Copernicus satellite images for free
3.3.1. Sentinel Hub EO Browser
The Sentinel Hub EO Browser (Fig. 3.3.1.1) is the first place to look for the archive of the European Space Agency’s Sentinel-1, Sentinel-2, Sentinel-3, Sentinel-5P, PROBA-V, and MERIS imagery.
This repository also gives access to the images collected by NASA’s Landsat-5, Landsat-7, Landsat-8, and MODIS satellites, and even NASA’s global imagery browse services (GIBS) products in one single place.
Note
Registered users have access to more features!
The Sentinel Hub EO Browser also offers some basic tools to explore Earth observation data, develop custom scripts for simple image analysis and also use third-party scripts.
Before browsing the image archives, sign up for a free account on Sentinel Hub EO Browser and then log in (Fig. 3.3.1.2).
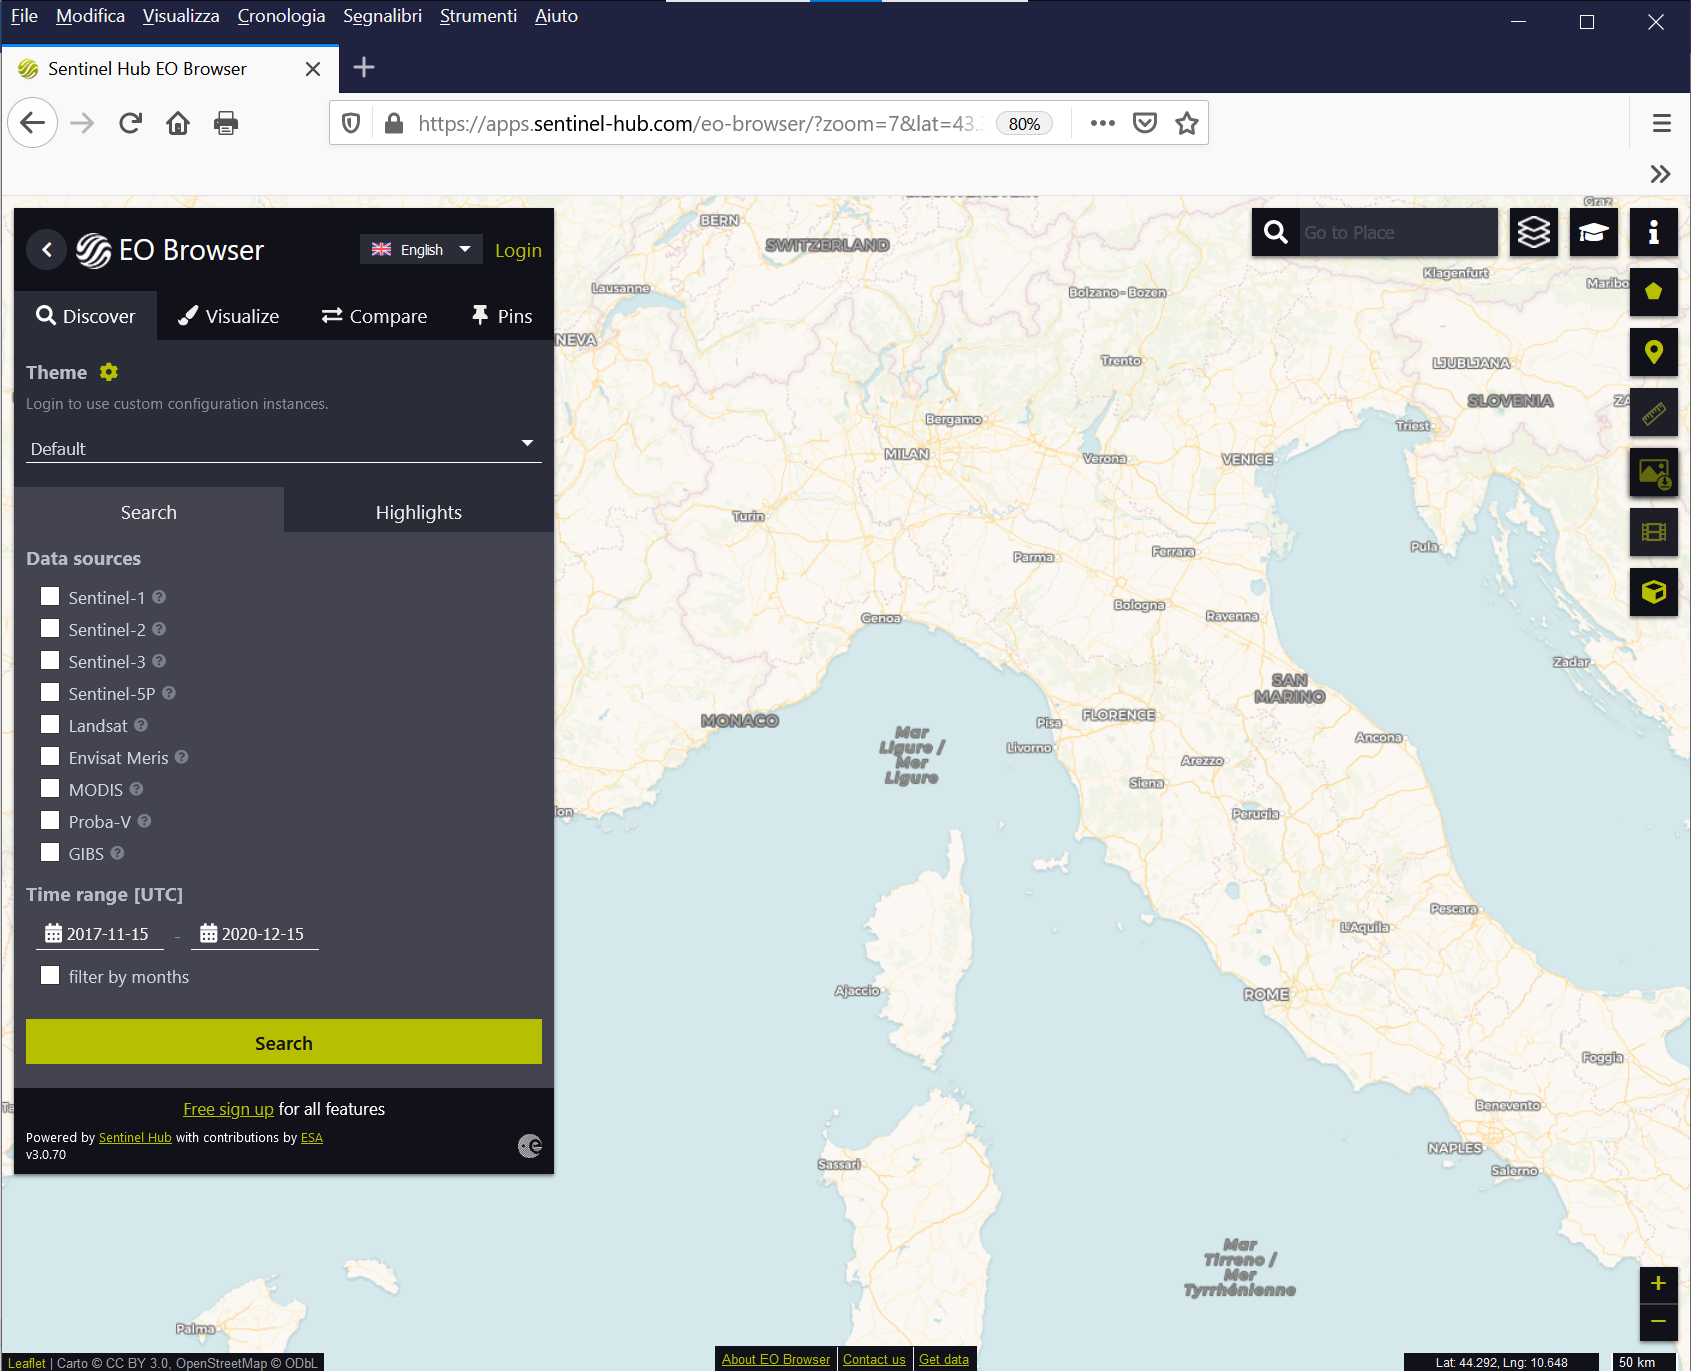
Fig. 3.3.1.1 Home page of the Sentinel Hub EO Browser.
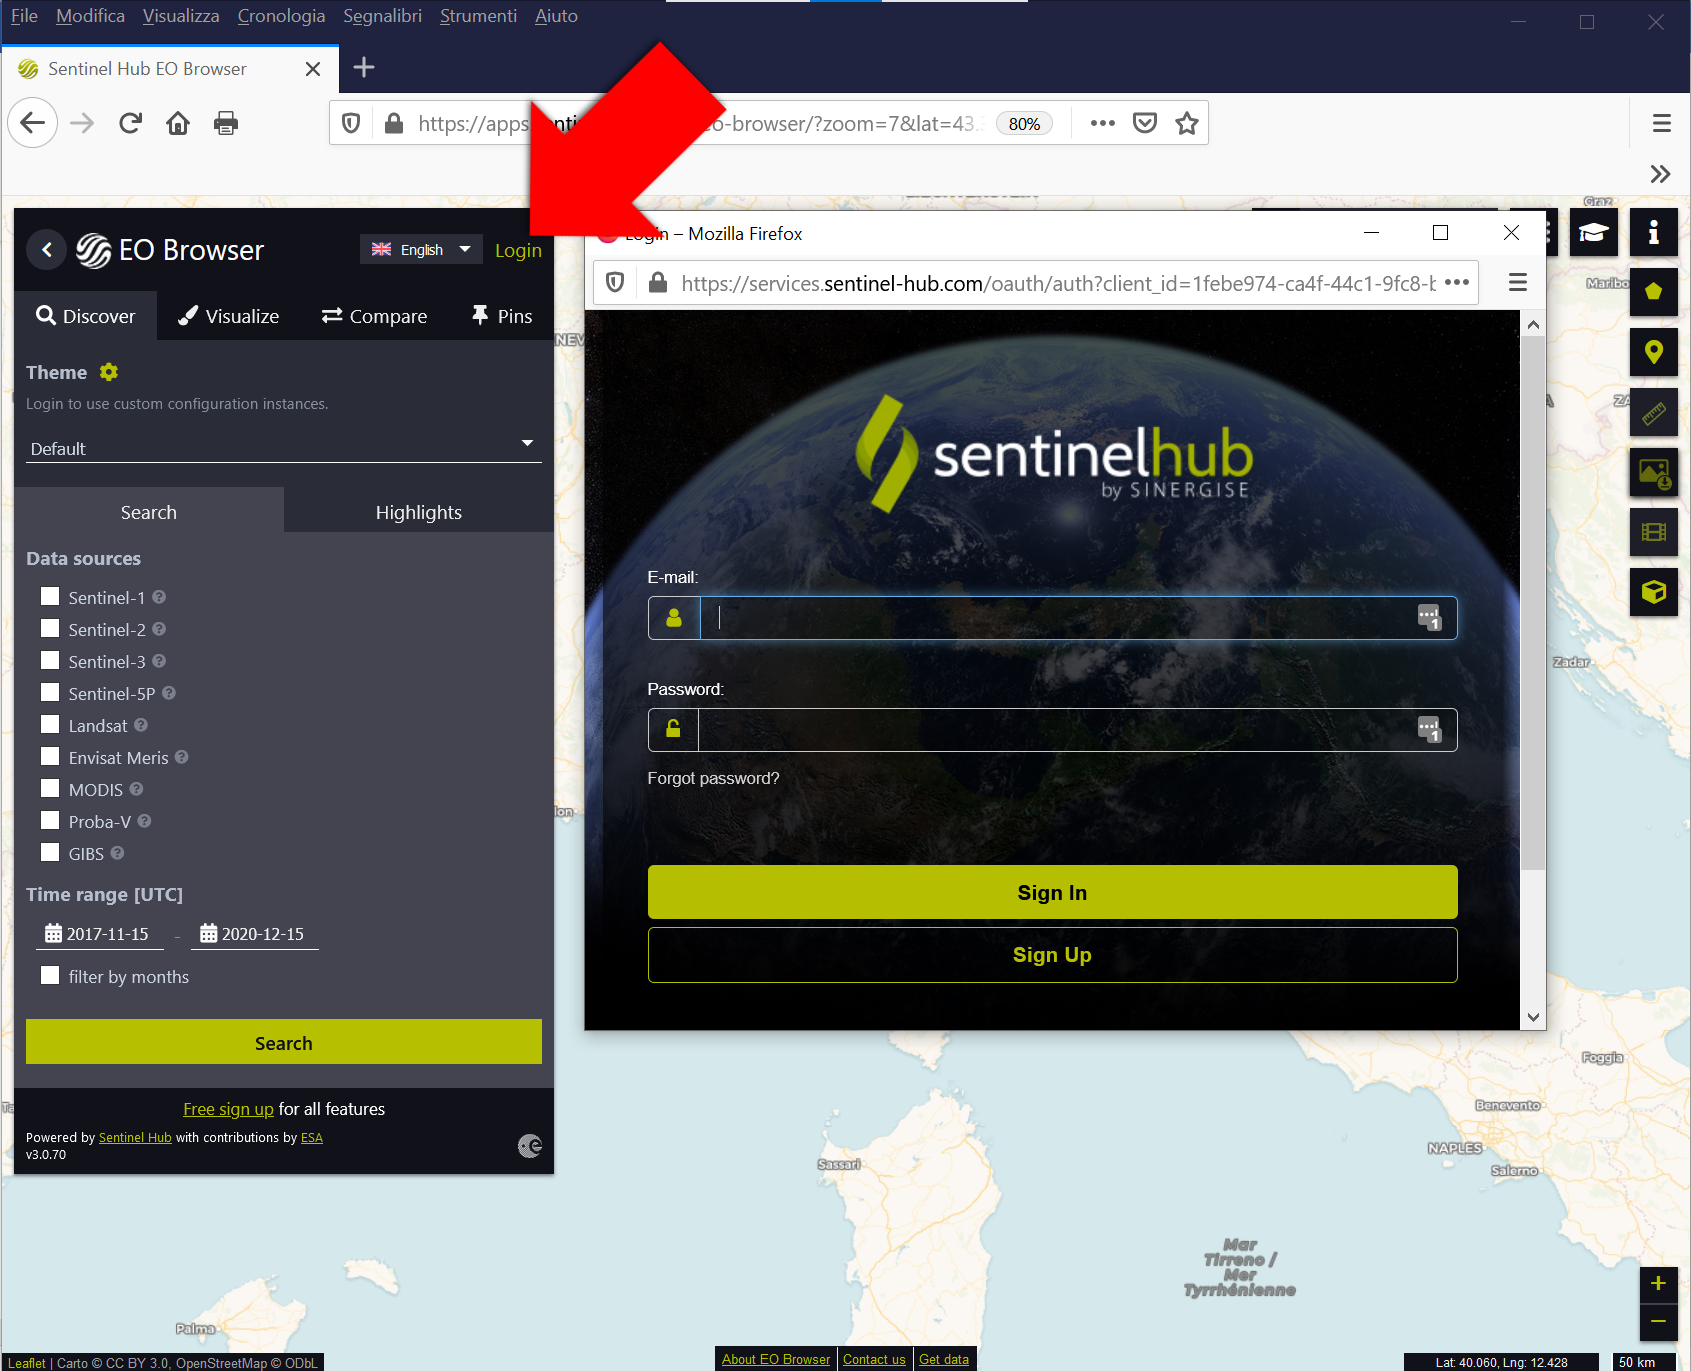
Fig. 3.3.1.2 Log in to the Sentinel Hub EO Browser.
3.3.1.1. How to select the correct products with Sentinel Hub EO Browser
Once logged in the Sentinel Hub EO Browser, configure the search criteria (Fig. 3.3.1.3):
- In this example, we look for Sentinel-2 images. Thus, select Sentinel-2 as a data source,
- Set Advanced search and select L2A (atmospherically corrected). This option limits the search to atmospherically corrected Sentinel-2 images only,
- Optionally, set the Max. cloud coverage to the desired level of maximum cloud cover accepted,
- Select the starting and ending Time range [UTC] by clicking the calendars,
- Optionally, select filter by months to limit the search to specific months in the time range,
- Click the Search button to search the archive.
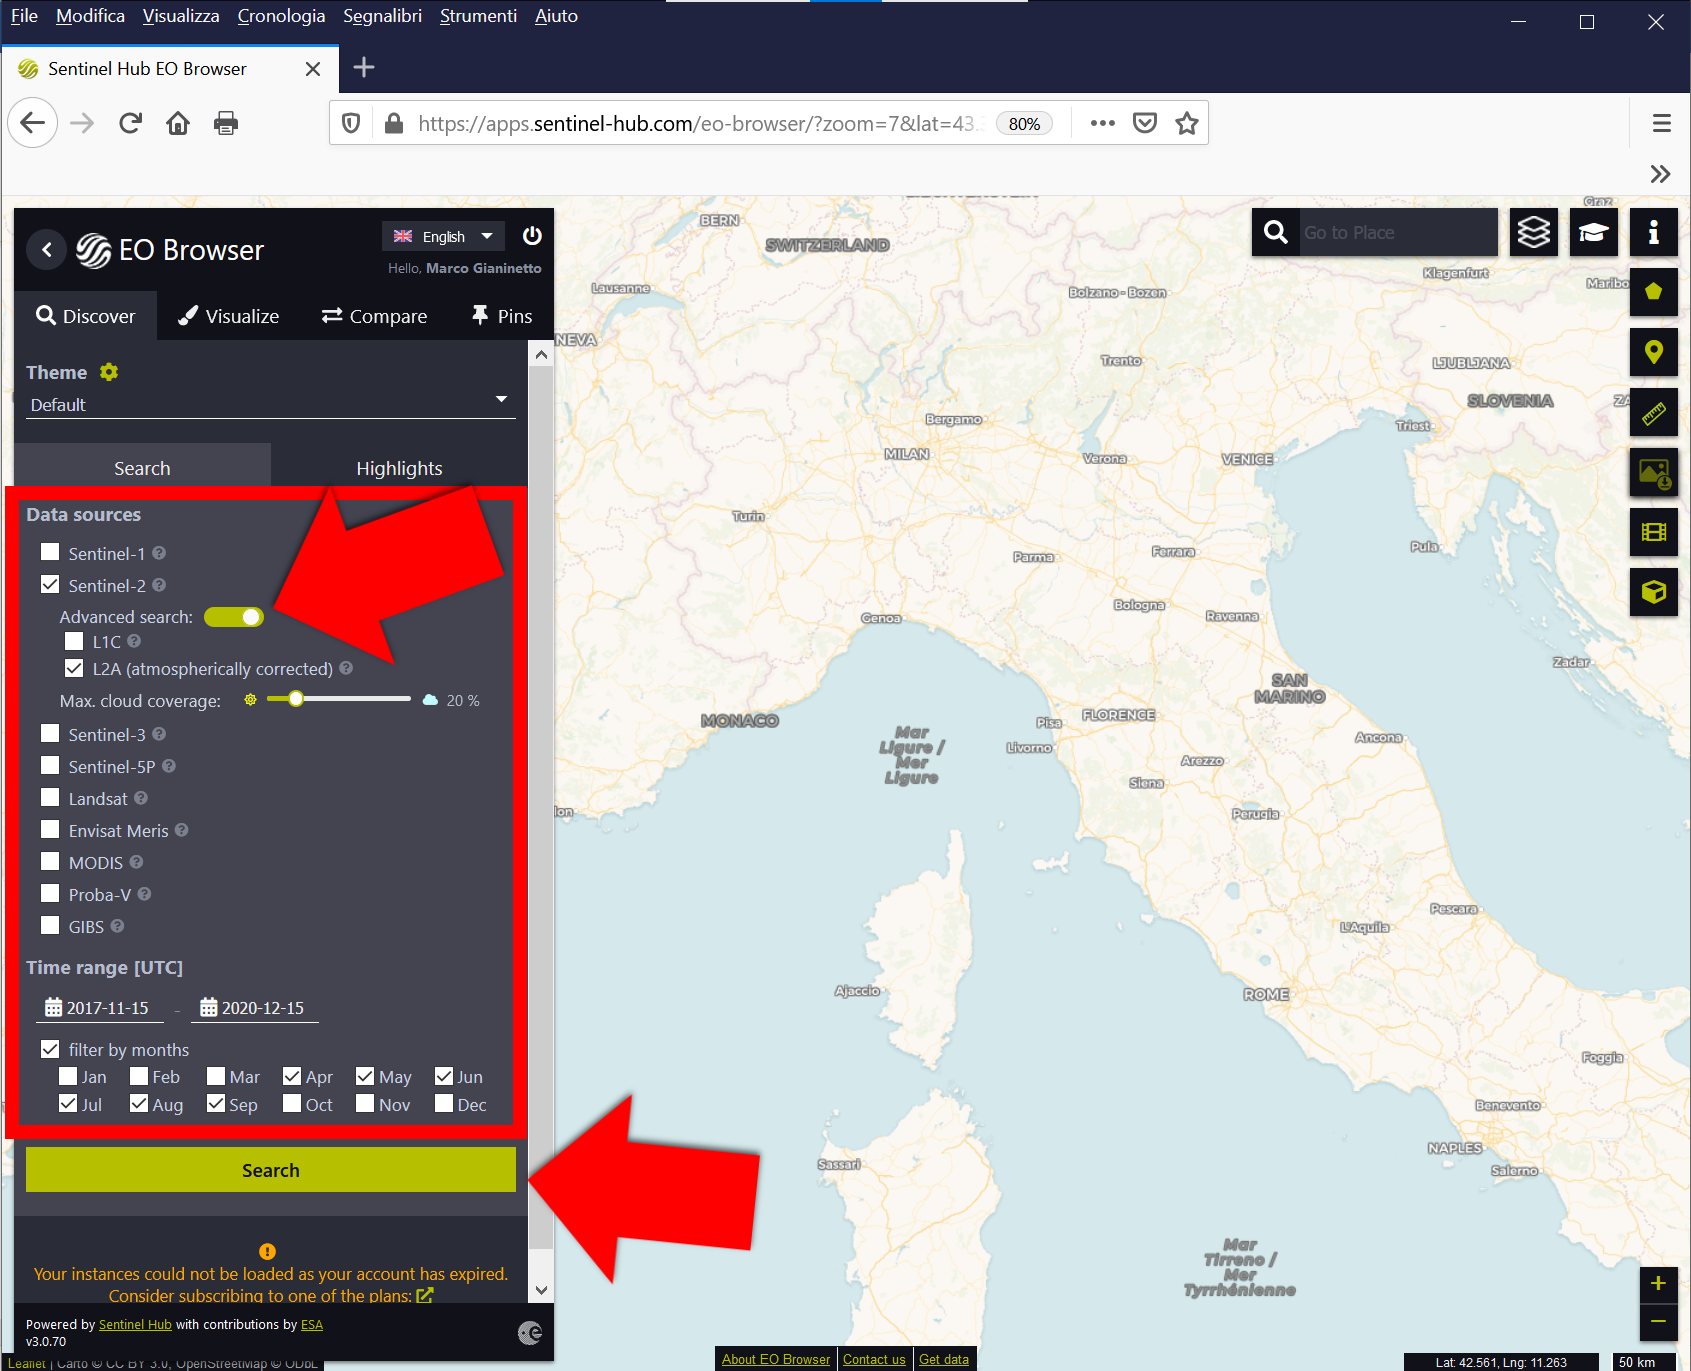
Fig. 3.3.1.3 Set the searching criteria.
Warning
Remember to use ONLY atmospherically corrected images!
Multispectral satellite images capture both the sunlight reflected by the Earth’s surface and the light scattered by the atmosphere. However, when monitoring the environment, atmospheric scattering is a noise that must be removed before image manipulation or analysis.
Sentinel-2 data provided as L1C products are uncorrected images. Sentinel-2 data provided as L2A products are atmospherically corrected images.
Only L2A products are ready for image processing!
3.3.1.2. How to view the satellite images with Sentinel Hub EO Browser
Select your image tile in the main window and click Visualize. Alternatively, you can load your image by clicking Visualize in the left panel (Fig. 3.3.1.4).
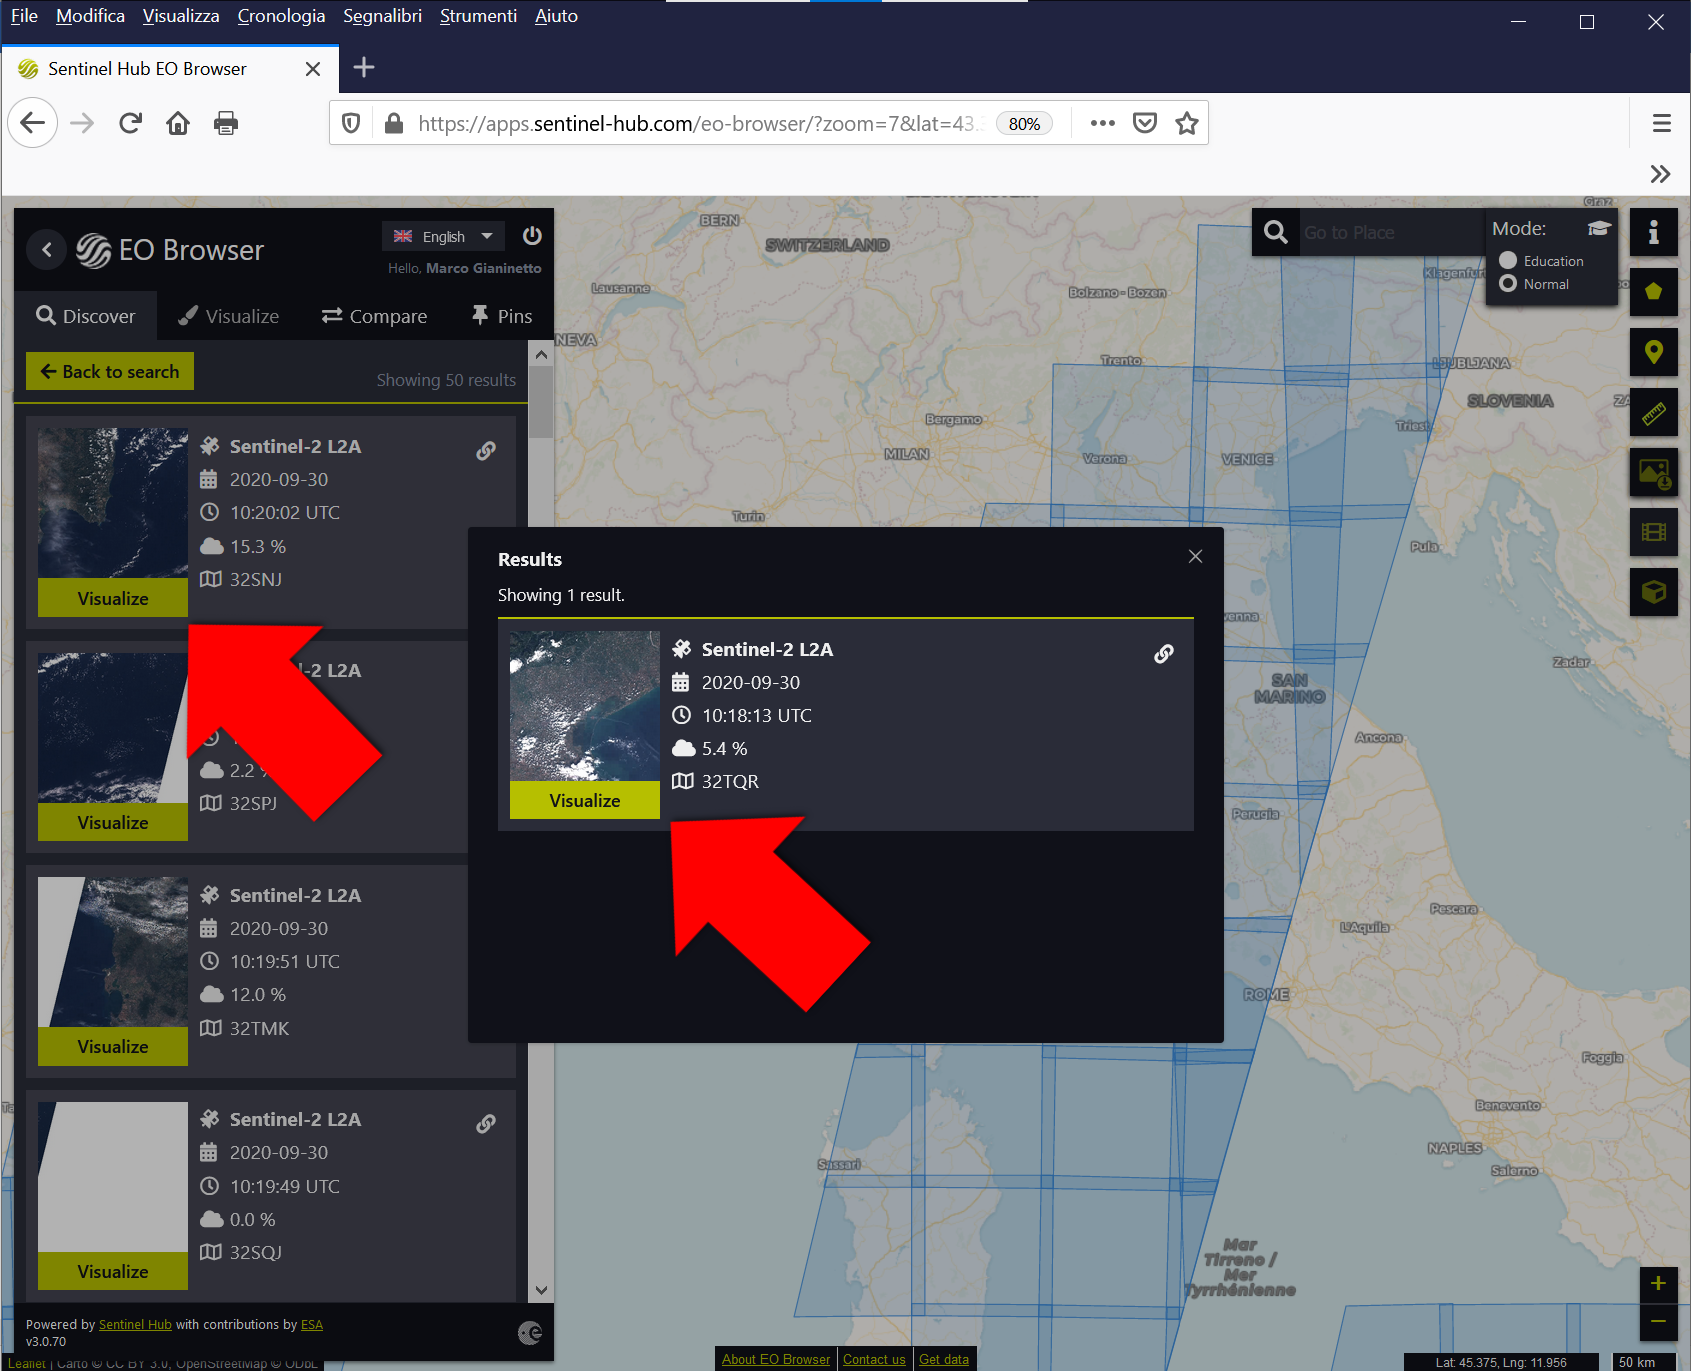
Fig. 3.3.1.4 Select your satellite image archived in the Sentinel Hub EO Browser.
By default, Sentinel Hub EO Browser opens a true colour image of the selected area (Fig. 3.3.1.5). For Sentinel-2, the Red, Green and Blue colours are recorded by spectral band 4, band 3, and band 2. Therefore, the Earth’s surface is shown as humans would see it naturally.
Note
True colour synthesis:
Satellite Red band → Image Red colour channel
Satellite Green band → Image Green colour channel
Satellite Blue band → Image Blue colour channel
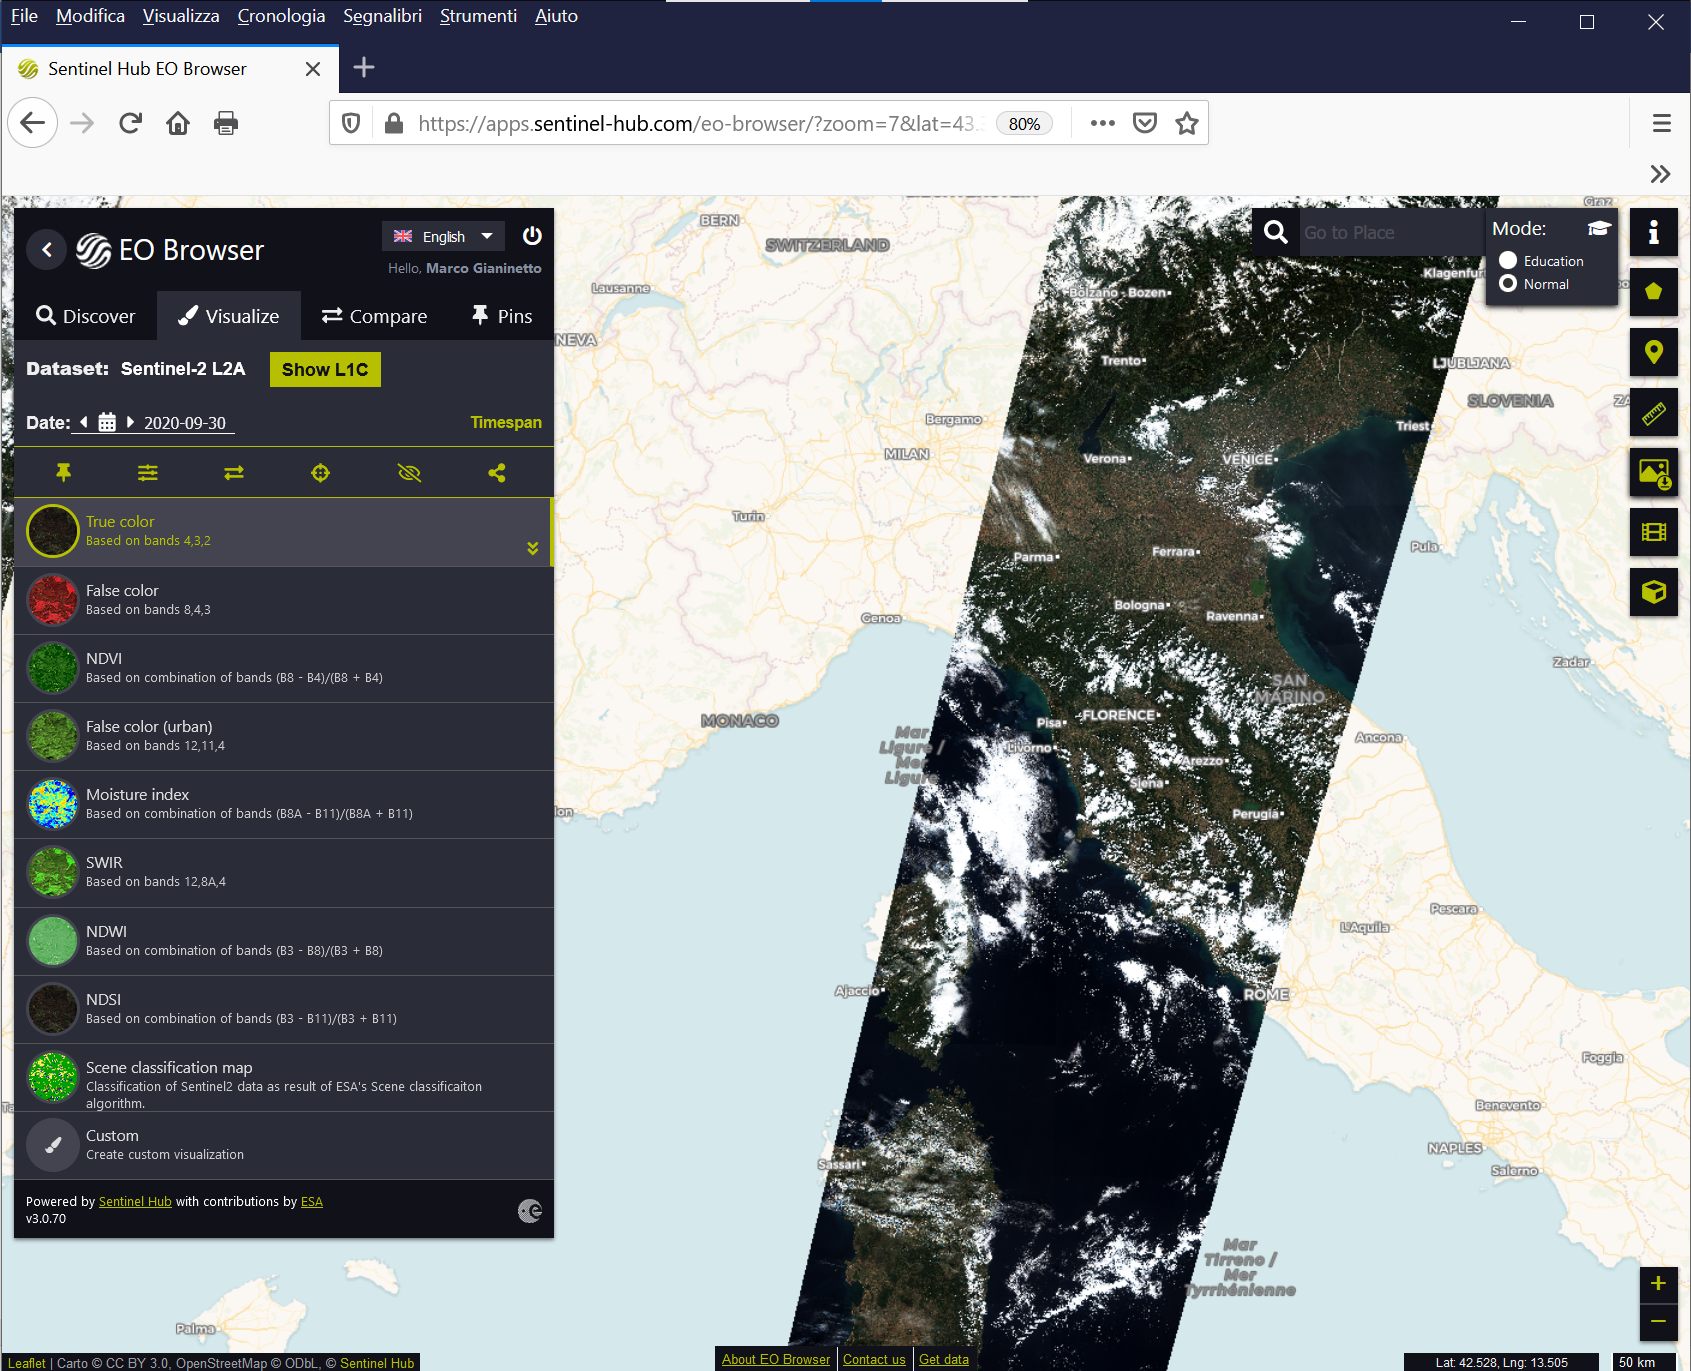
Fig. 3.3.1.5 The satellite image(s) are displayed.
However, Sentinel Hub EO Browser shows the following additional pre-built colour composites:
a. False colour (Fig. 3.3.1.6). This is the well-know colour composite used to evaluate vegetation biomass and health. It uses the near infrared (NIR), Red, and Green spectral bands, represented as Red, Green and Blue colours respectively:
- Vegetation is from dark red to light red,
- Urban areas are cyan or tan,
- Bare soils are from dark brown to light brown,
- Water is black or dark blue,
- Snow and ice are cyan or blue,
- Clouds are white,
- Wildfires are white (the smoke plume).
Note
False colour synthesis:
Satellite NIR band → Image Red colour channel
Satellite Red band → Image Green colour channel
Satellite Green band → Image Blue colour channel
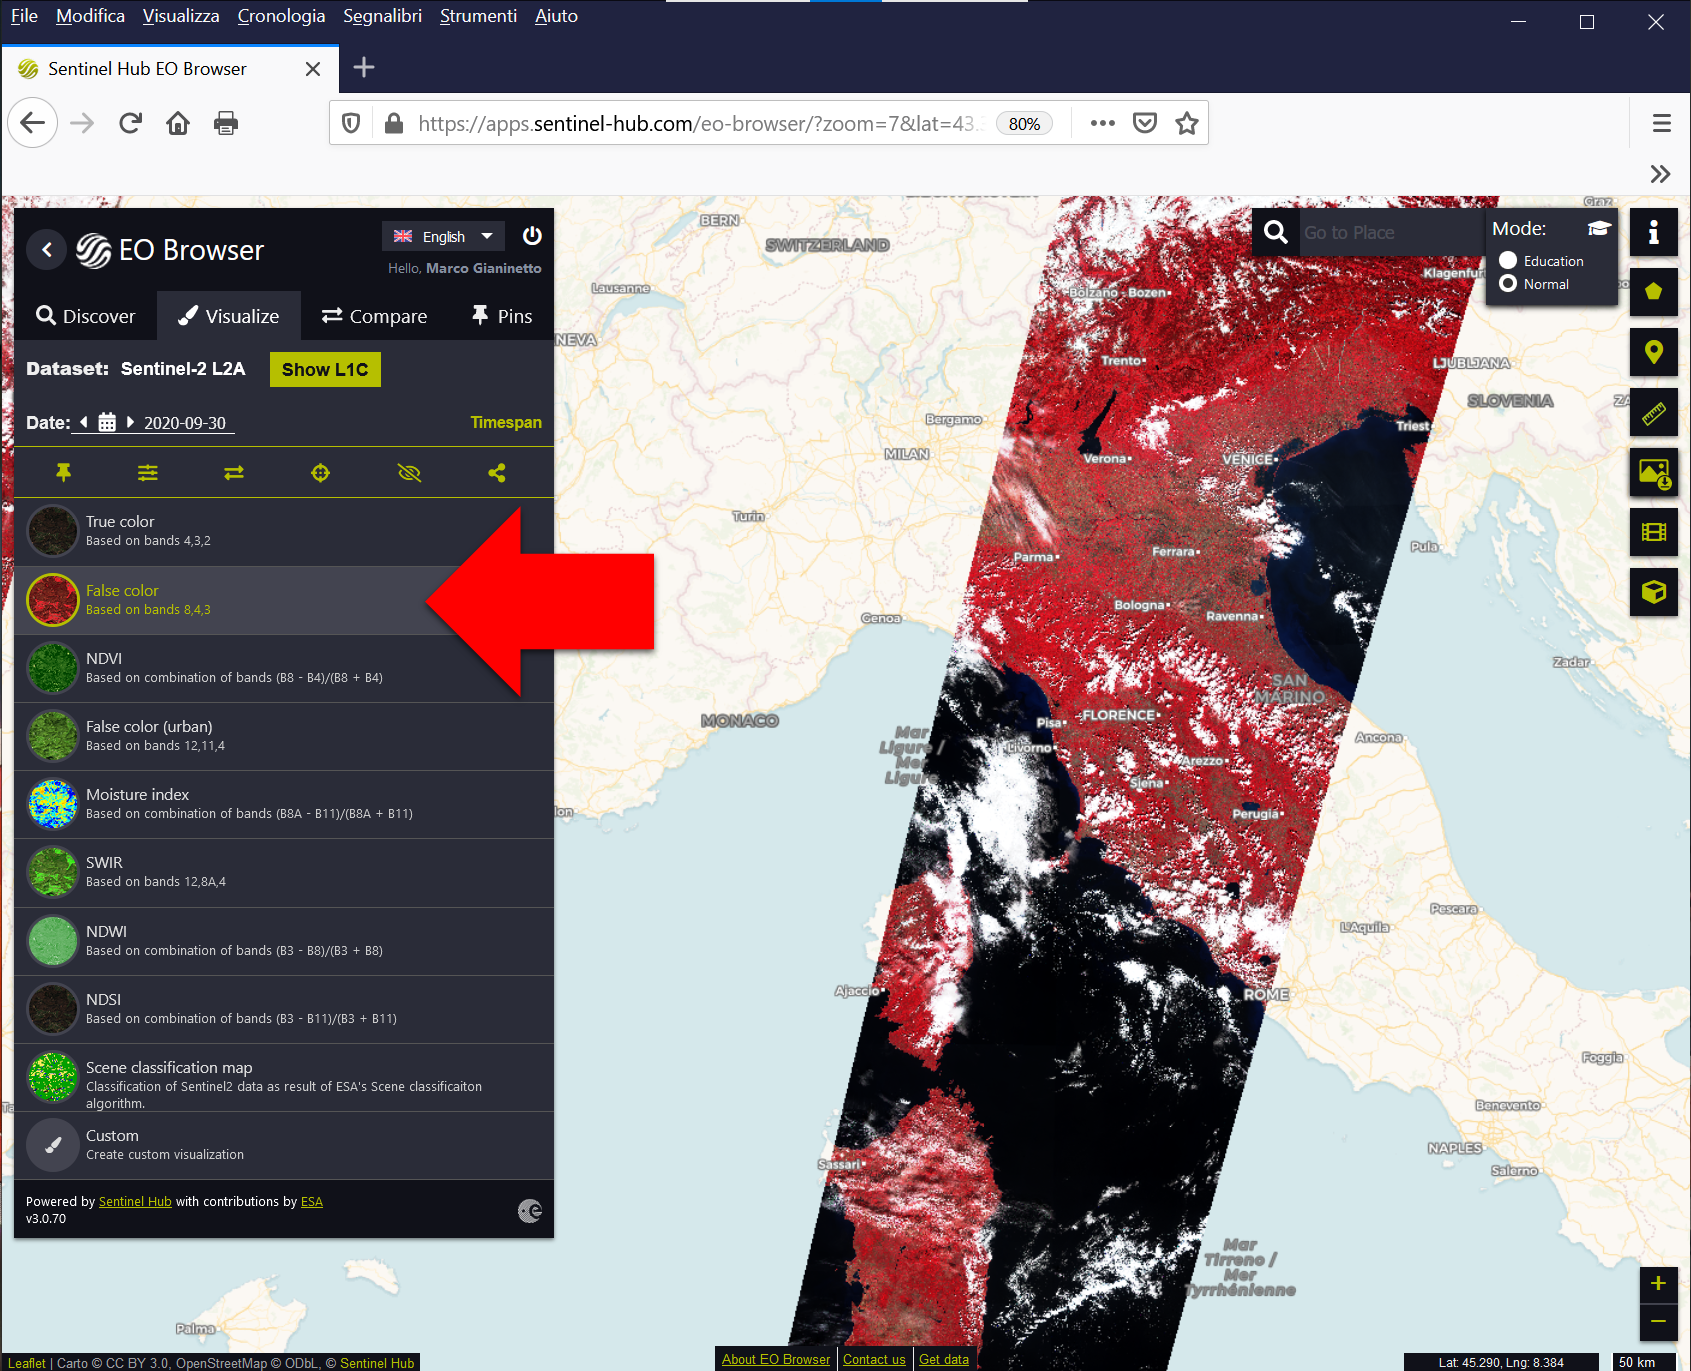
Fig. 3.3.1.6 False colour composite.
b. False colour (urban) (Fig. 3.3.1.7). This colour composite is used to highlight details in the urbanized areas more clearly and spot wildfires. It uses two shortwave infrared (SWIR) spectral bands and the Red spectral bands, represented as Red, Green and Blue colours respectively:
- Vegetation is green,
- Urban areas are white, grey, or purple,
- Bare soils are shown in a variety of colours,
- Water is black or dark blue,
- Snow and ice are blue,
- Wildfires are red and yellow,
- Clouds qre white.
Note
False colour (urban) synthesis:
Satellite SWIR band 1 → Image Red colour channel
Satellite SWIR band 2 → Image Green colour channel
Satellite Red band → Image Blue colour channel
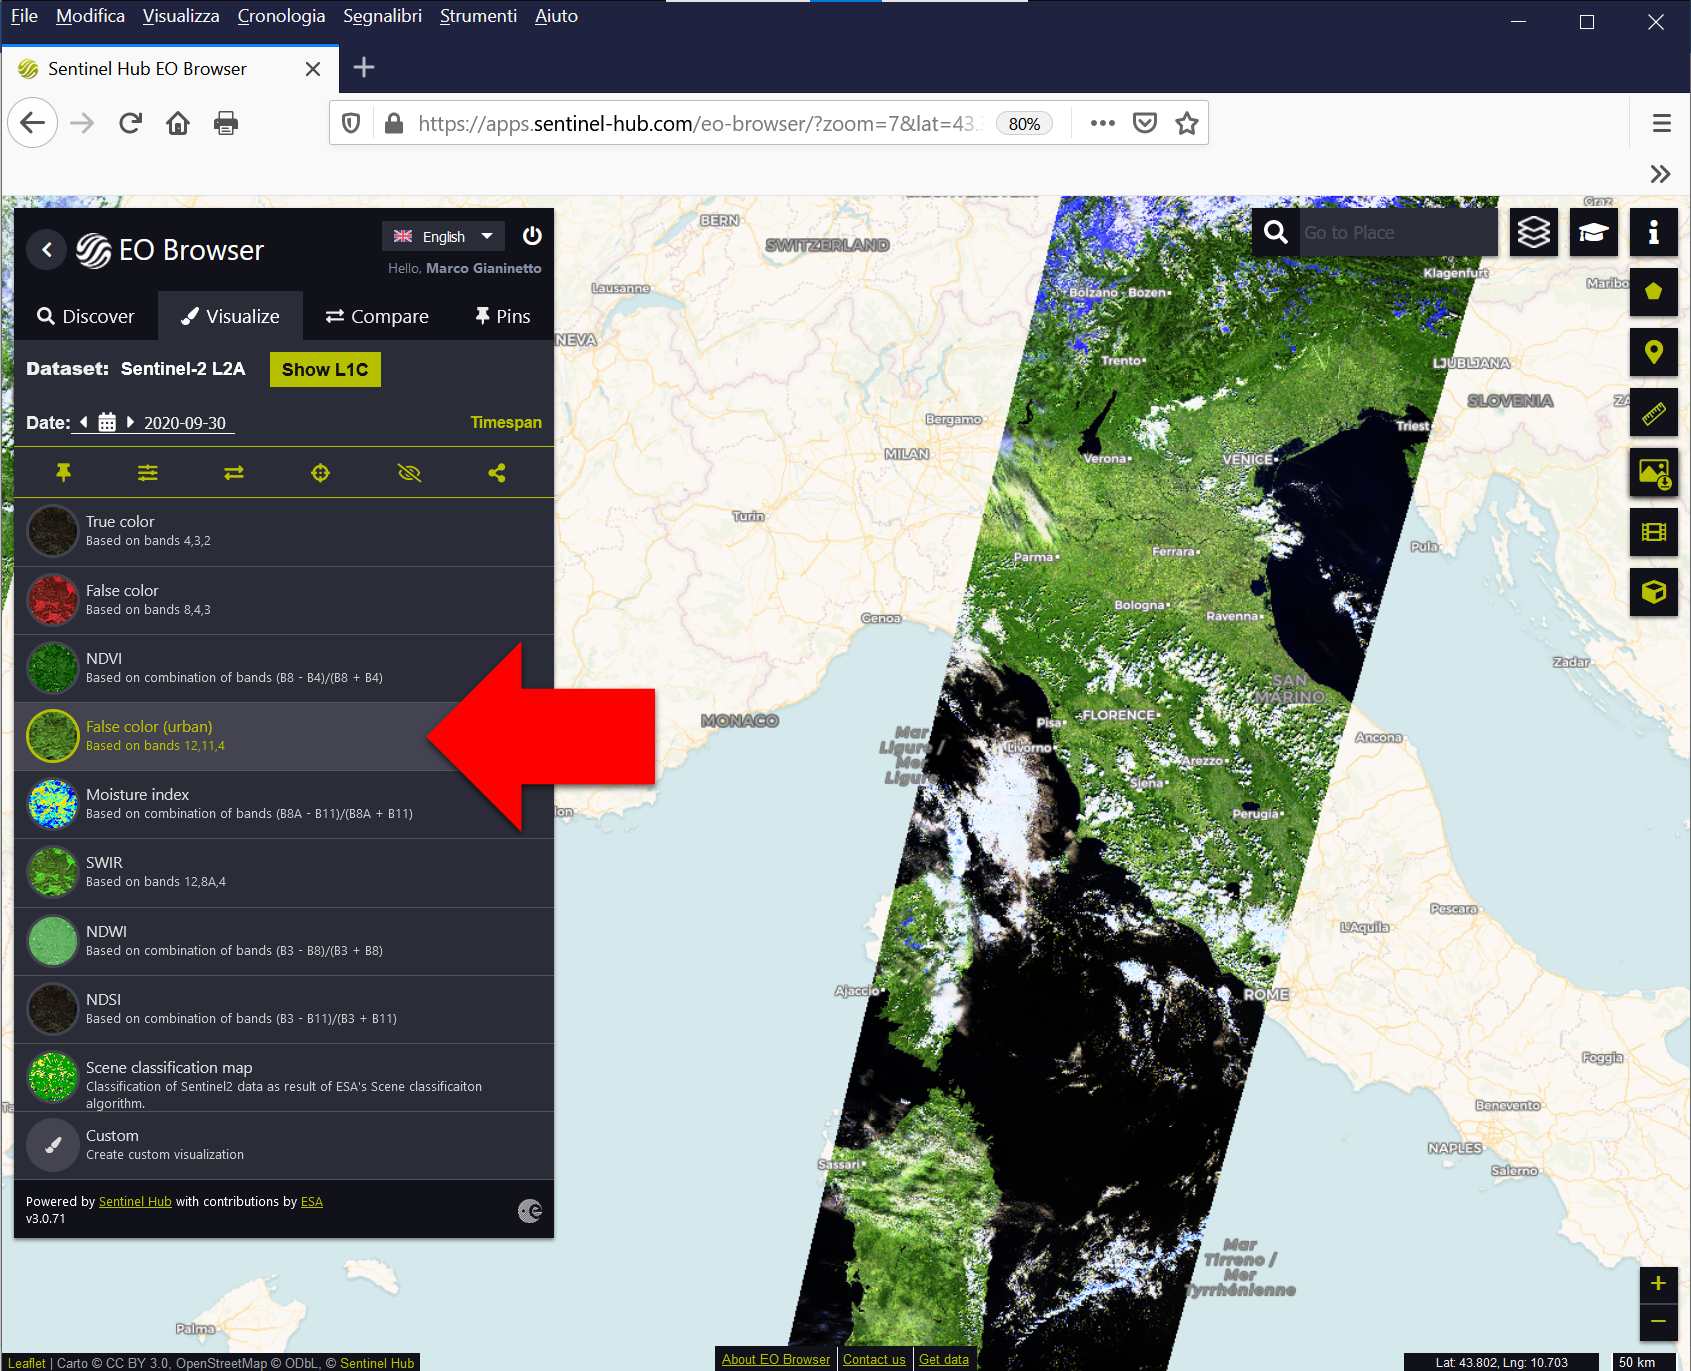
Fig. 3.3.1.7 False colour (urban) composite.
c. SWIR (Fig. 3.3.1.8). This colour composite is used to distinguish between clouds, snow, and ice. Besides, it is useful for geological mapping. It uses a shortwave infrared (SWIR), a near infrared (NIR) and the red spectral bands, represented as red, green and blue colours respectively:
- Vegetation is green,
- Urban areas are brown,
- Bare soils are from dark brown to light brown,
- Water is black or dark blue,
- Snow and ice are blue,
- Clouds are white,
- Rocks are shown in a variety of colours.
Note
SWIR colour synthesis:
Satellite SWIR band → Image Red colour channel
Satellite NIR band → Image Green colour channel
Satellite Red band → Image Blue colour channel
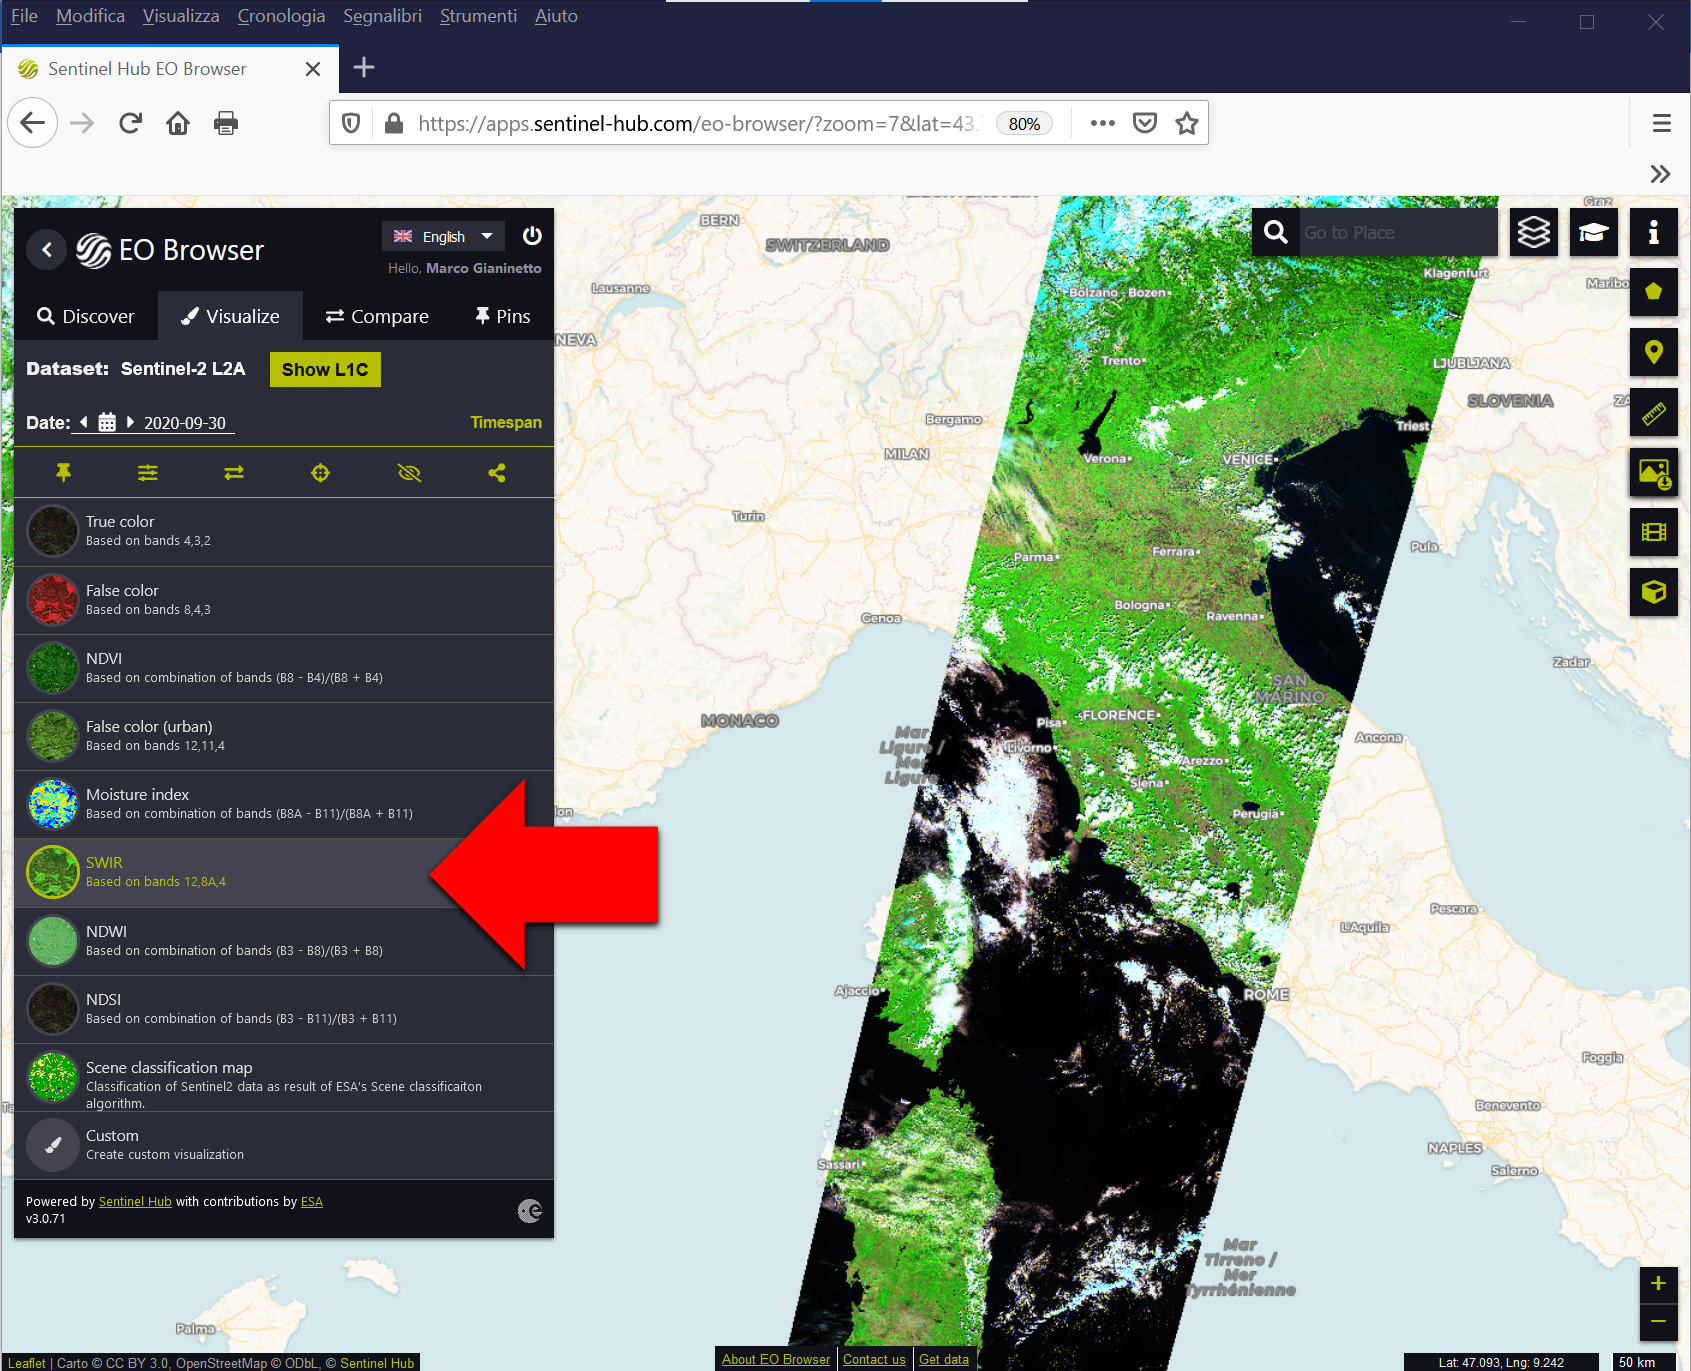
Fig. 3.3.1.8 Shortwave infrared (SWIR) composite.
Sentinel Hub EO Browser also shows the maps of some basic spectral indices. These parameters are useful to recognize different land cover types and monitor the status of vegetated land. Specifically:
a. NDVI (Fig. 3.3.1.9). The Normalized Difference Vegetation Index (NDVI) is the basic greenness vegetation index used to estimate biomass and health of the green vegetation. The index is calculated using a combination of the near infrared (NIR) and red spectral bands (see Normalized Difference Vegetation Index (NDVI)):
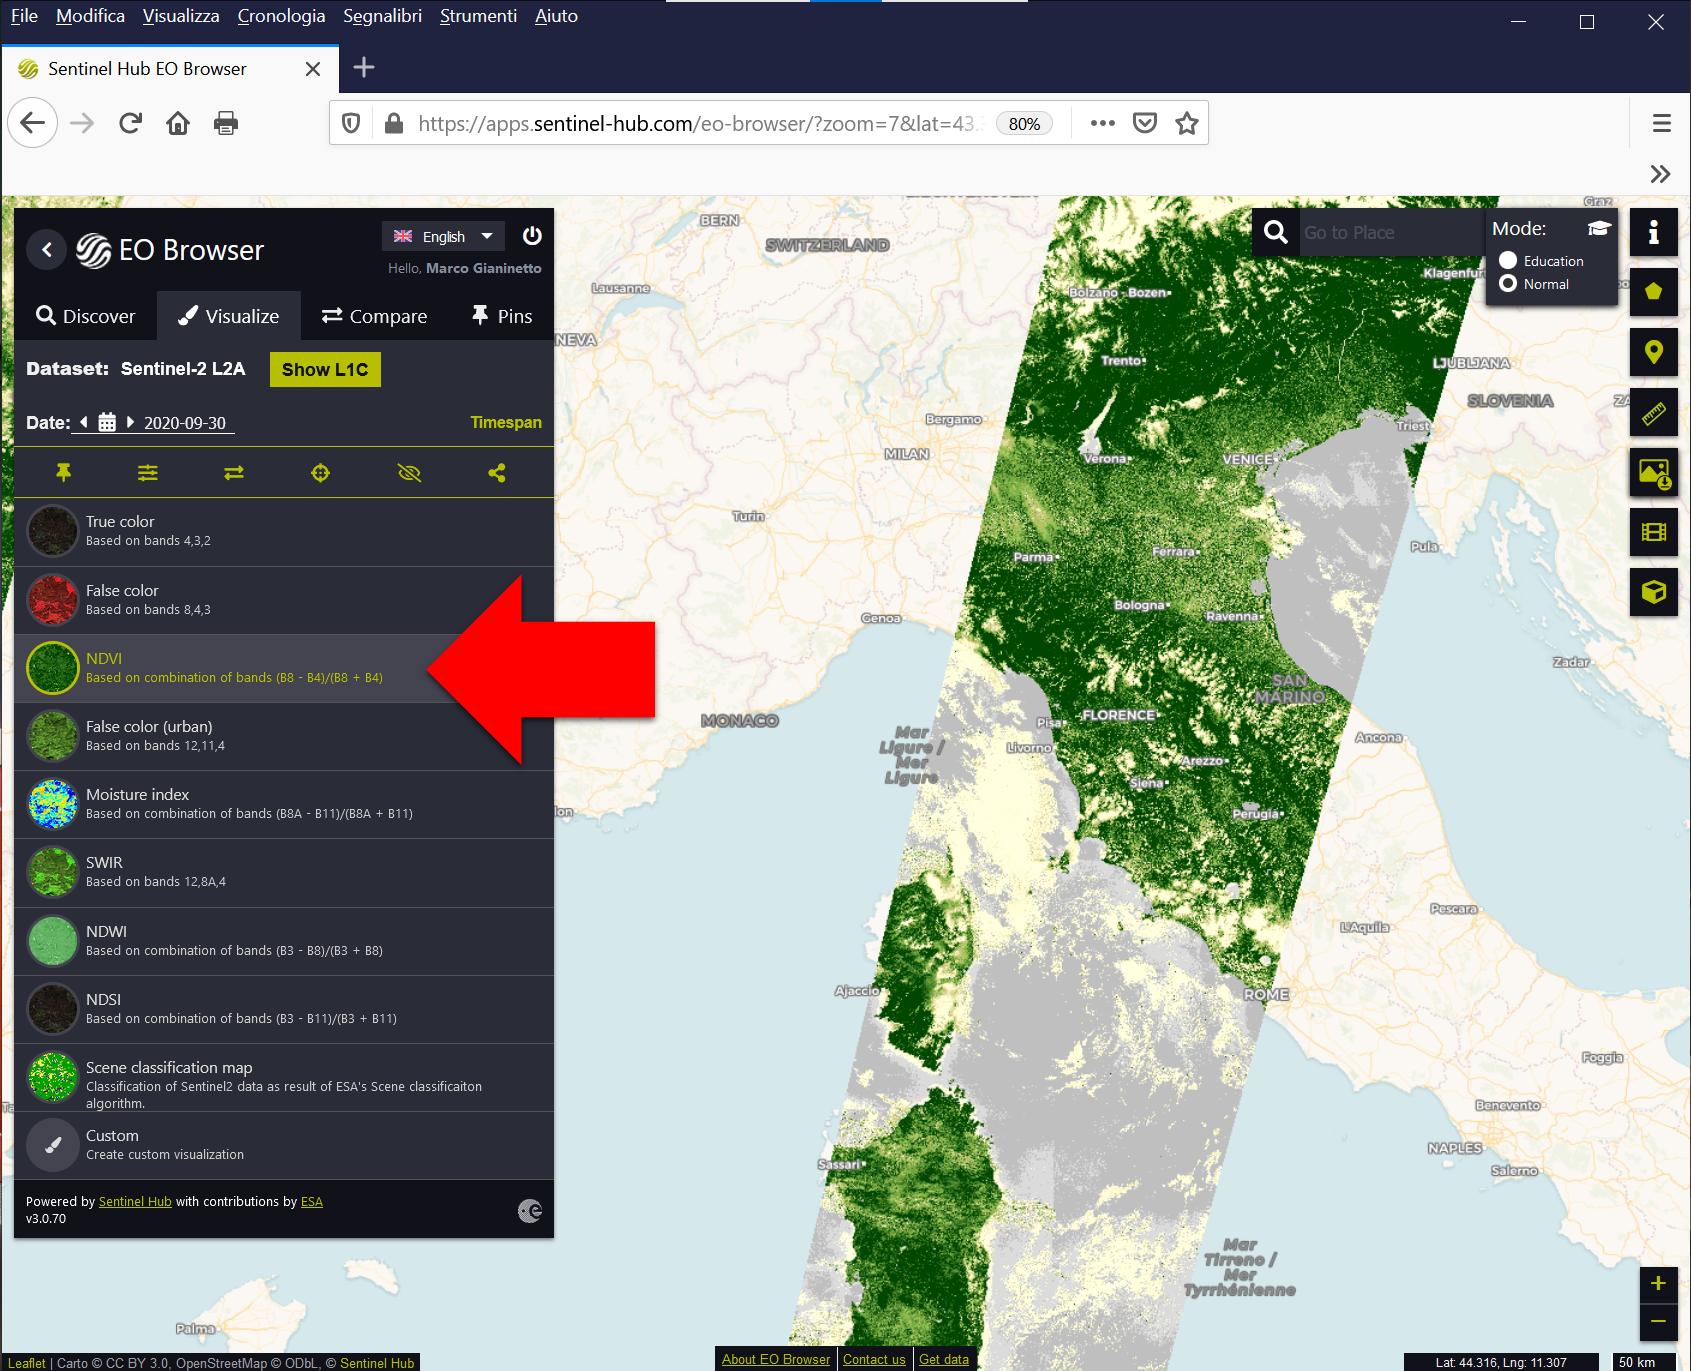
Fig. 3.3.1.9 Map of the Normalized Difference Vegetation Index (NDVI).
b. Moisture index (Fig. 3.3.1.10). The Normalized Difference Moisture Index (NDMI) is used to estimate vegetation water content and monitor droughts. The index is calculated using a combination of the near infrared (NIR) and shortwave infrared (SWIR) spectral bands:
Note
The Normalized Difference Moisture Index (NDMI) is also referred as Normalized Difference Water Index (NDWI) (see Normalized Difference Water Index (NDWI)).
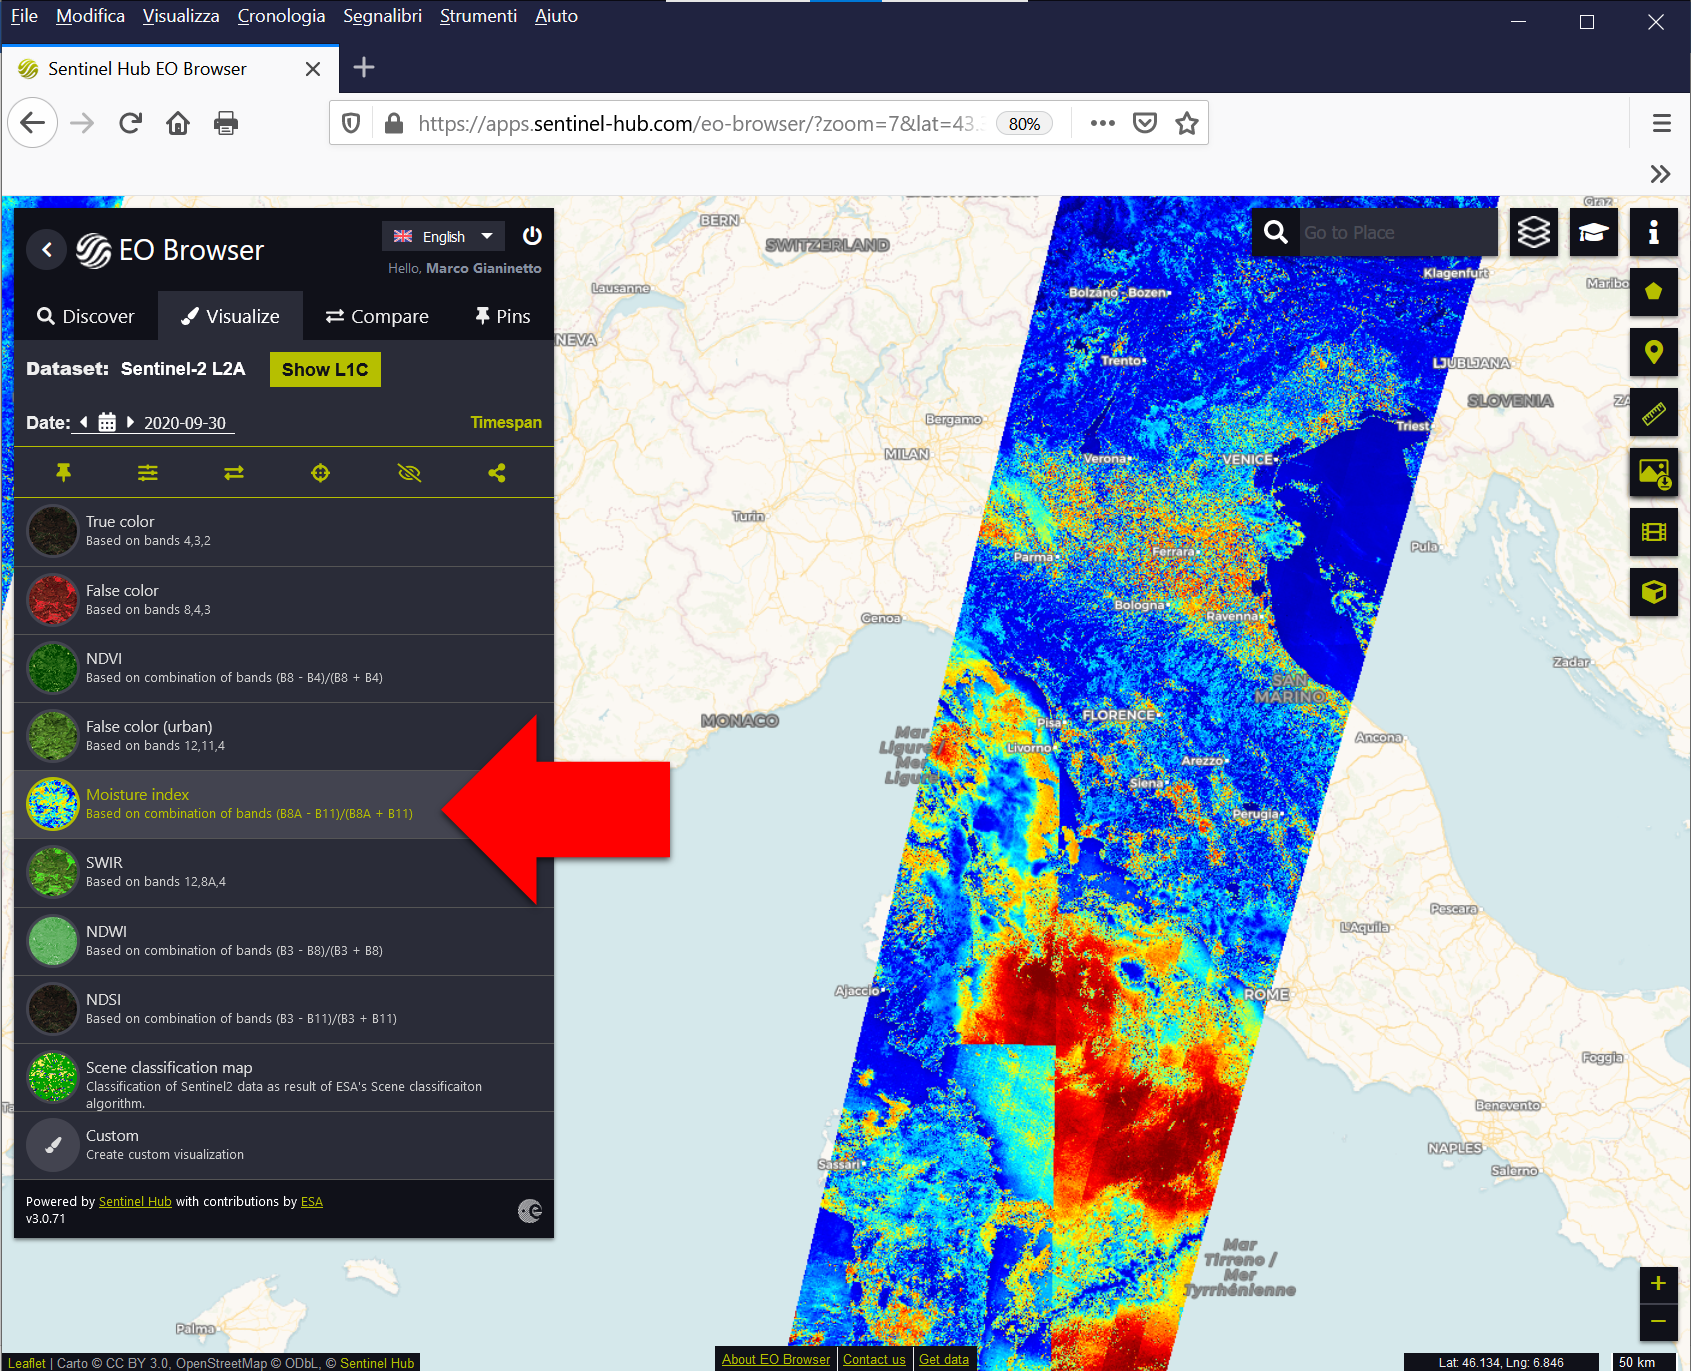
Fig. 3.3.1.10 Map of the Normalized Difference Moisture Index (NDMI).
c. NDWI (Fig. 3.3.1.11). The Normalized Difference Water Index (NDWI) is used to map water bodies. The index is calculated using a combination of the near infrared (NIR) and green spectral bands (see Normalized Difference Water Index (NDWI)):
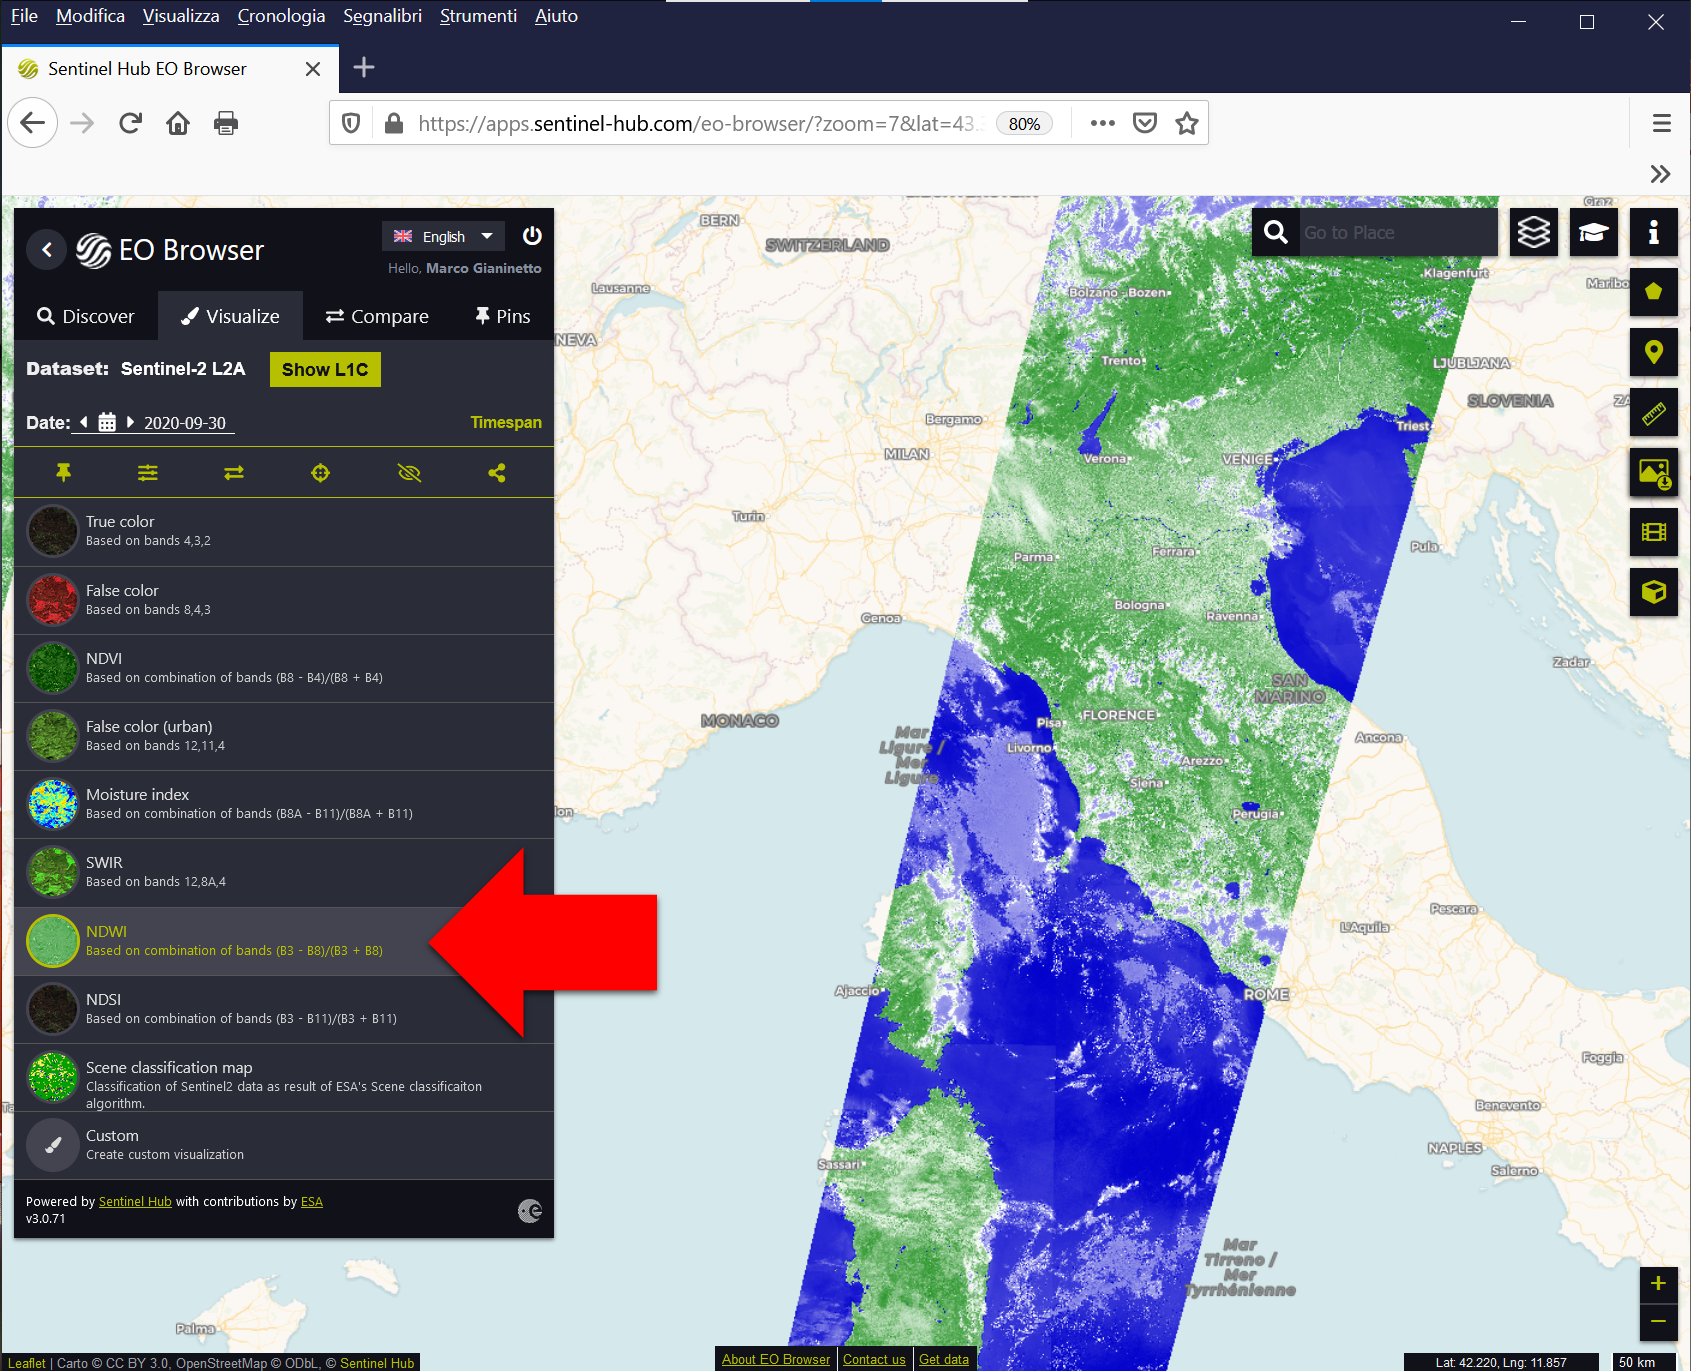
Fig. 3.3.1.11 Map of the Normalized Difference Water Index (NDWI).
d. NDSI (Fig. 3.3.1.12). The Normalised Difference Snow Index (NDSI) is used to map clouds and snow. The index is calculated using a combination of the shortwave infrared (SWIR) and green spectral bands (see Normalized Difference Snow Index (NDSI)):
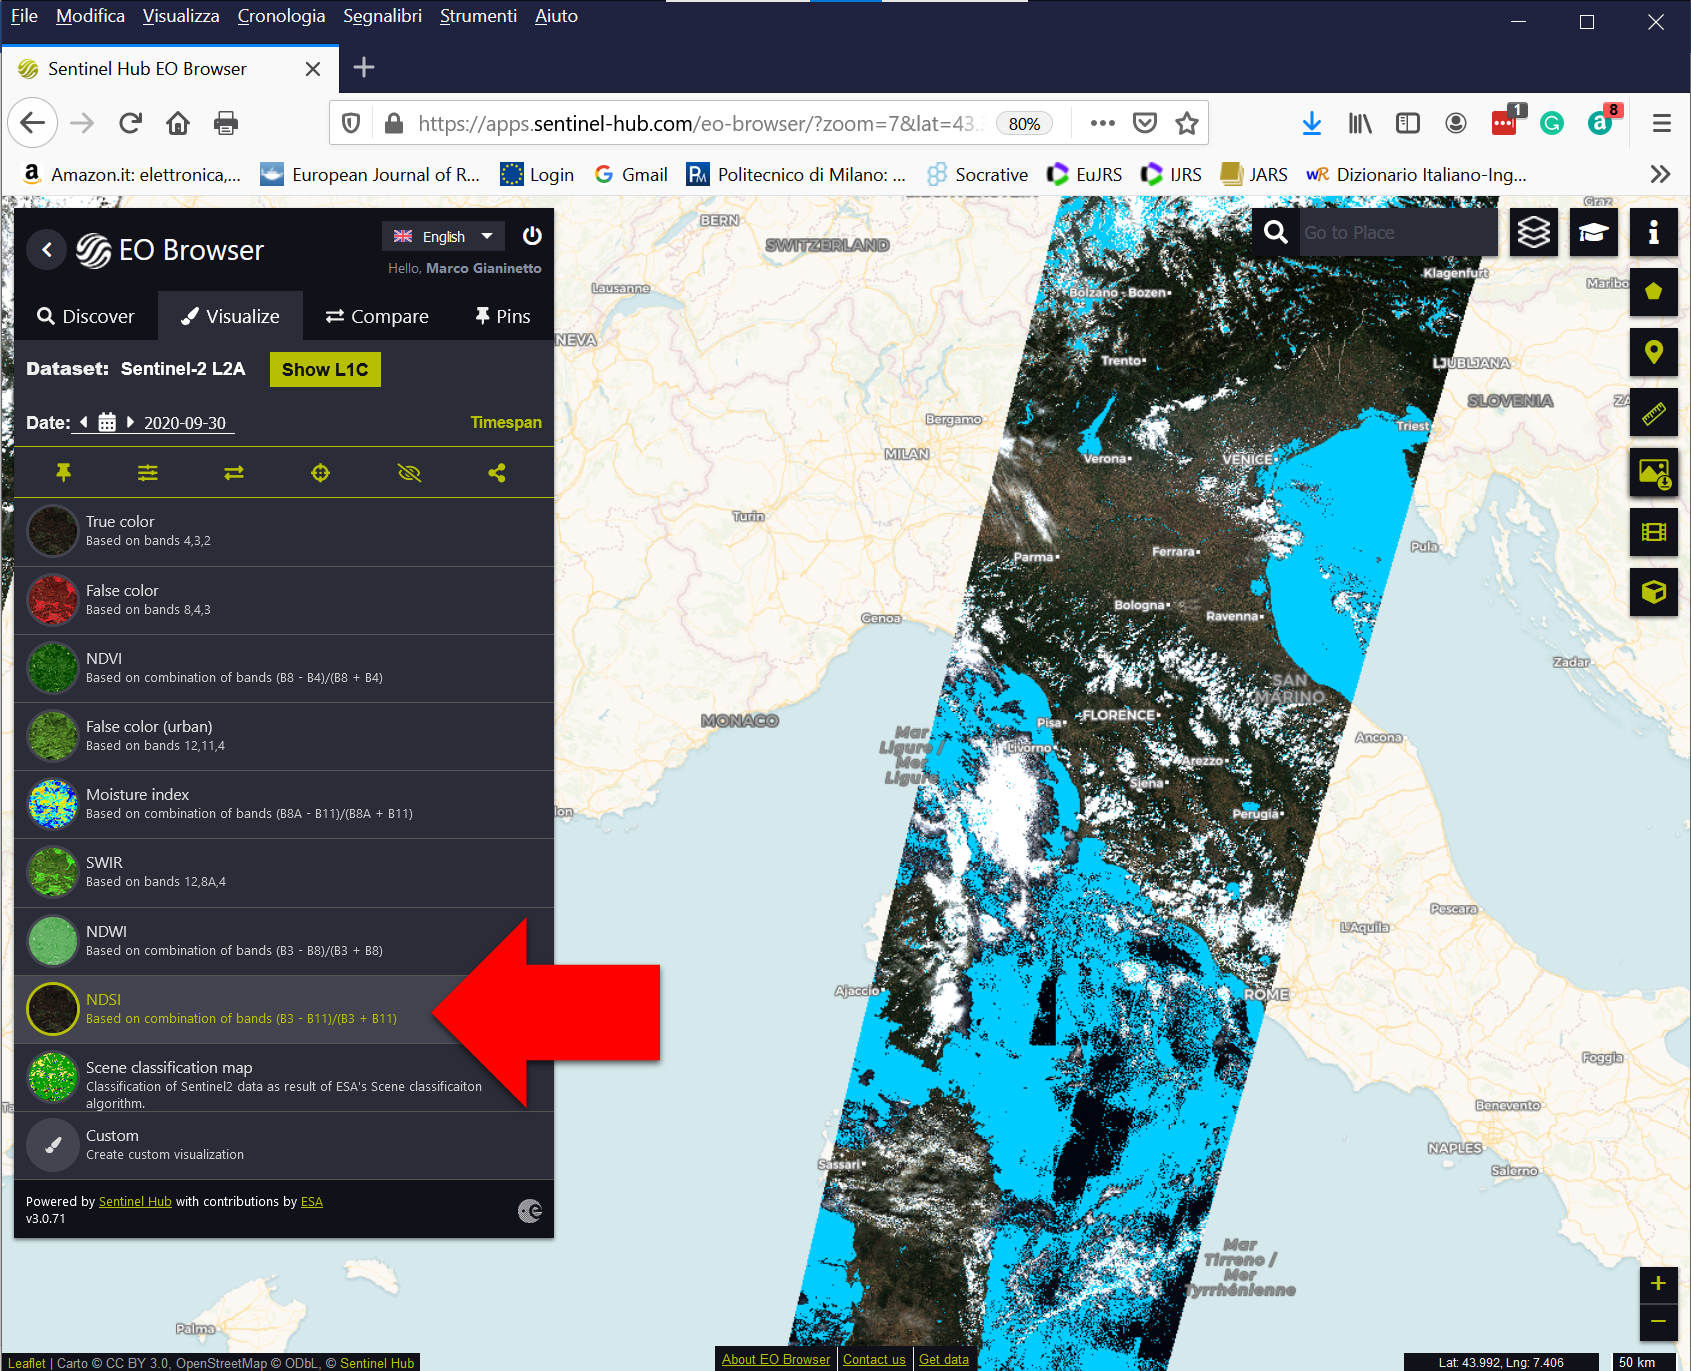
Fig. 3.3.1.12 Map of the Normalised Difference Snow Index (NDSI).
Additionally, there is a simple scene classification map with the following classes (Fig. 3.3.1.13):
Vegetation,
Not-vegetated,
Water,
Snow or ice,
Clouds
- (medium probability of) Cloud,
- (high probability of) Cloud,
- Thin cirrus (i.e. cloud),
Shadows
- Dark features and shadows,
- Cloud shadows,
Missing data
- No data,
- Saturated or defective pixel.
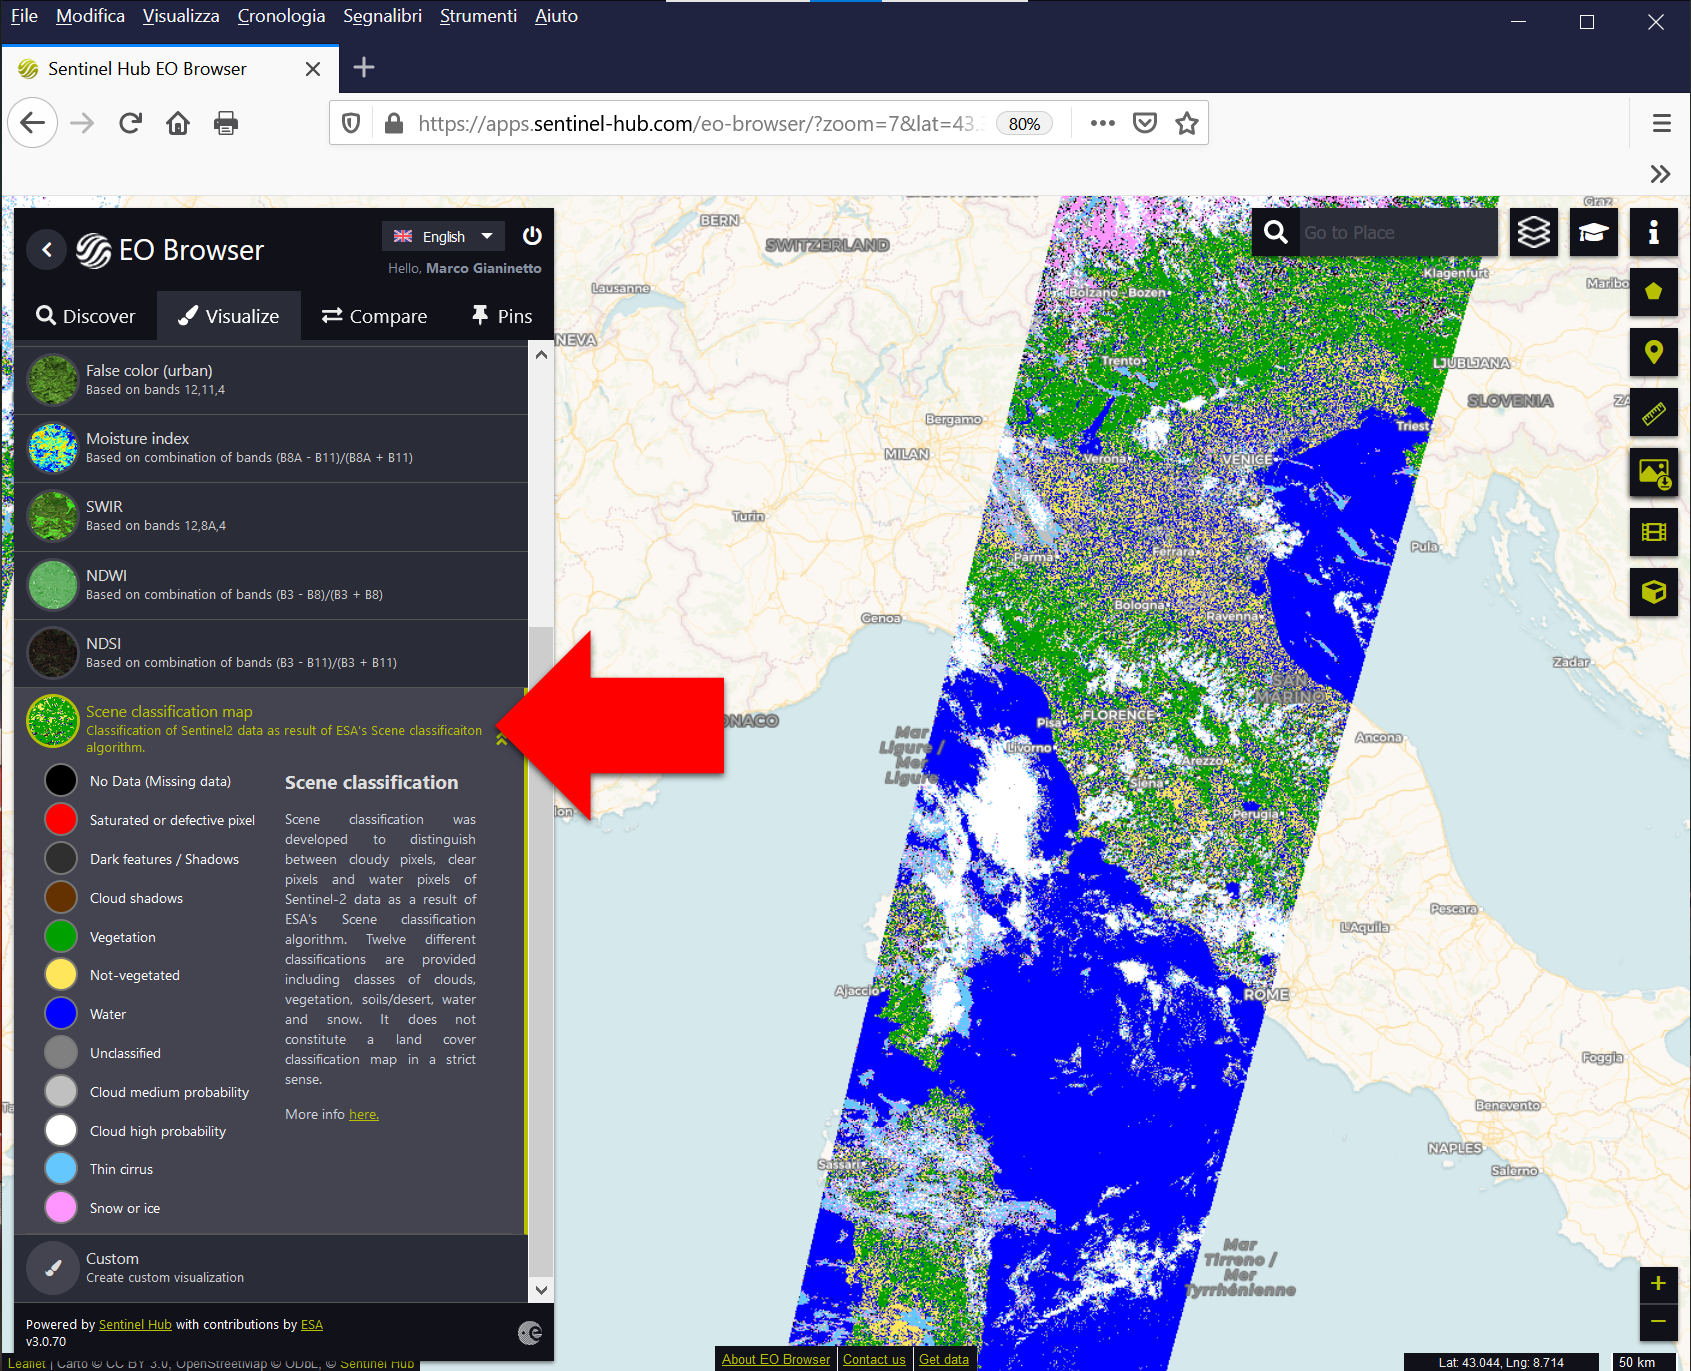
Fig. 3.3.1.13 Scene classification map.
Hint
Looking for a specific spectral index?
The Index DataBase is a collection of spectral indices for different applications and sensors. Here you find a selection of 250 spectral indices designed to fit the images of the Sentinel-2 satellite.
If you like to import these spectral indices into Sentinel Hub EO Browser, try these javascripts.
3.3.1.3. How to download the data with Sentinel Hub EO Browser
Warning
Sign up for Copernicus Open Access Hub.
The images searched with Sentinel Hub EO Browser are downloaded from the Copernicus Open Access Hub. Sign up for a free account!
- Click the green chain symbol to show the download link at the bottom of the image (SciHub link:),
- Click the link to download the data.
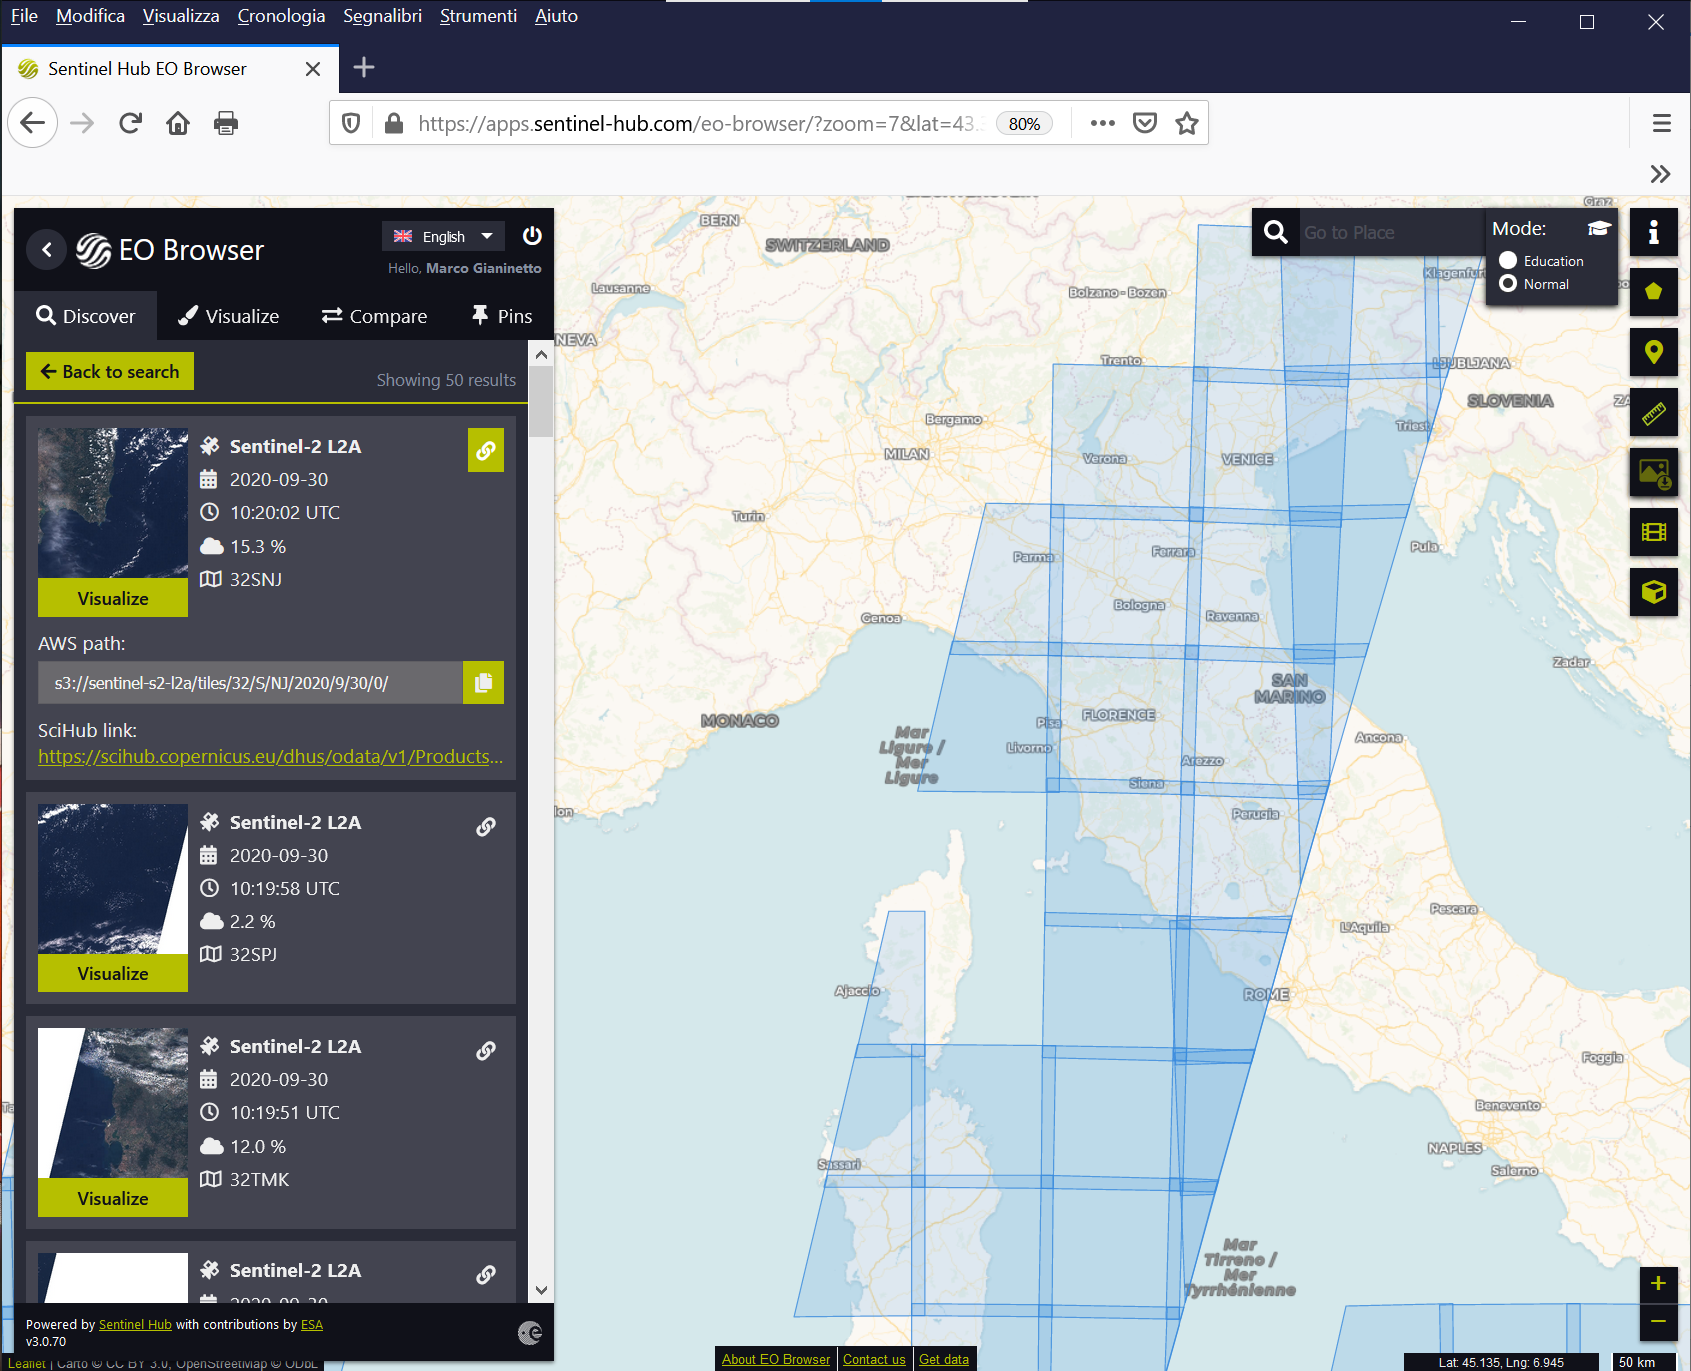
Fig. 3.3.1.14 Activate the link to download the images.
- If you are already logged in the Copernicus Open Access Hub, the download starts immediately. Otherwise, you will be prompted for user name and password of Copernicus Open Access Hub.
Caution
Username & password for Sentinel Hub EO Browser are different from that of Copernicus Open Access Hub!
See also
For additional information, see the Sentinel Hub EO Browser user guide
3.3.2. Some alternative repositories
Alternative European repositories are the Copernicus Open Access Hub (Fig. 3.3.2.1) and the DIASs (Fig. 3.3.2.2) listed below. However, they are usually more complex than Sentinel Hub EO Browser. They might also have a different level of maturity, data archived and user-friendliness.
Discover more information on the Copernicus Open Access Hub and on the five Data and Information Access Services (DIAS):
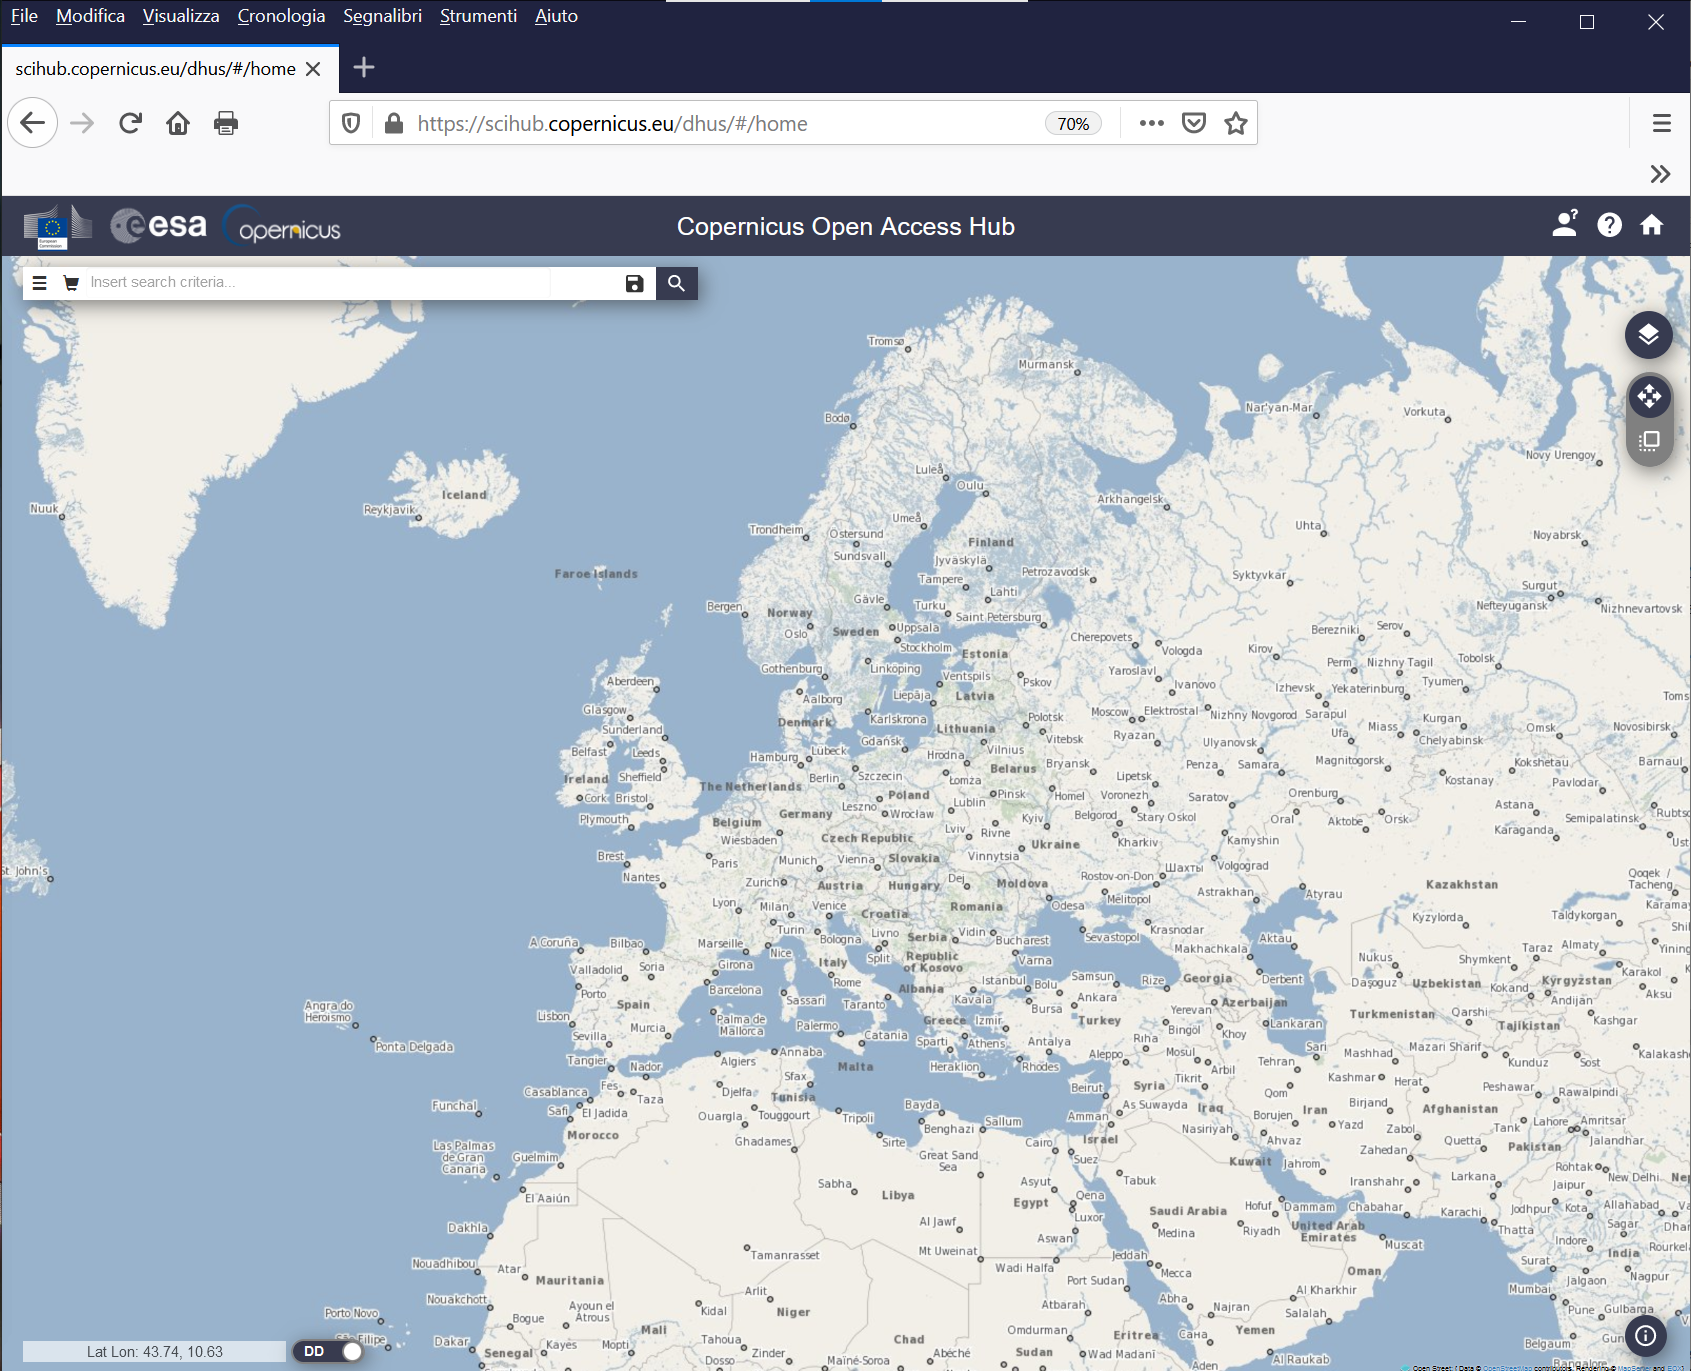
Fig. 3.3.2.1 Copernicus Open Access Hub.
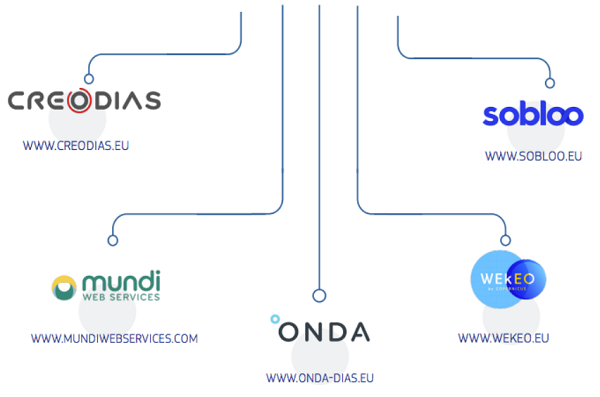
Fig. 3.3.2.2 Data and Information Access Services (credit: European Commission).
Caution
Sentinel images could also be downloaded from the US repositories EarthExplorer and GloVis. However, this repository mirrors only L1C products (i.e. images which are NOT atmospherically corrected)!
(v.2103211807)