1.10. Printing maps with QGIS
Styling is important not only for the single layers: to make an understandable and effective map, the entire map layout should be studied and carefully composed. The following exercise will focus on creating an effective map layout, with the basic elements that a map should contain as the legend, the title, the scalebar, etc.
The map to be composed, representing the water surface temperature distribution on Northern Italian insubric lakes, will contain the following data:
Raster data:
- Temperature_distribution
Vector data:
- River_network
- Municipalities_OSM
These listed layers need to be present and activated (ticked) in your Layers Panel before to start. Be careful also to respect this order of listing to see Temperature_distribution layer on the top of the other ones.
To create a map layout follow the steps on Fig. 1.10.1: go to Project menu → New Print Layout (1) or press Ctrl+P on your keyboard. It will open a tab where you can type the title of the print layout you want to create (2), then by clicking on OK (3), a map layout project will be opened: you can simply work there to compose your map with all the needed items.
Looking at Fig. 1.10.2, representing the New Print Layout Window, it is possible to see there are different icons on the very left of the window: we will use some of them to add the different basic map elements: the map itself, the legend, the map title, the north arrow and the scalebar.
Click on the Add Map icon (2) and then click on the position on the blank page where you want your map to be attached: by simply clicking OK for the New item Properties, in your page it will appear what it is shown in your QGIS Map panel. Check if the map content is adequately centered or zoomed, if not you can adjust them back in QGIS Map panel and they will be automatically updated in your Print Layout. In the New Print Layout window you can use also the Select/Move item (1) icon to move or resize the Map (or also the other map elements).
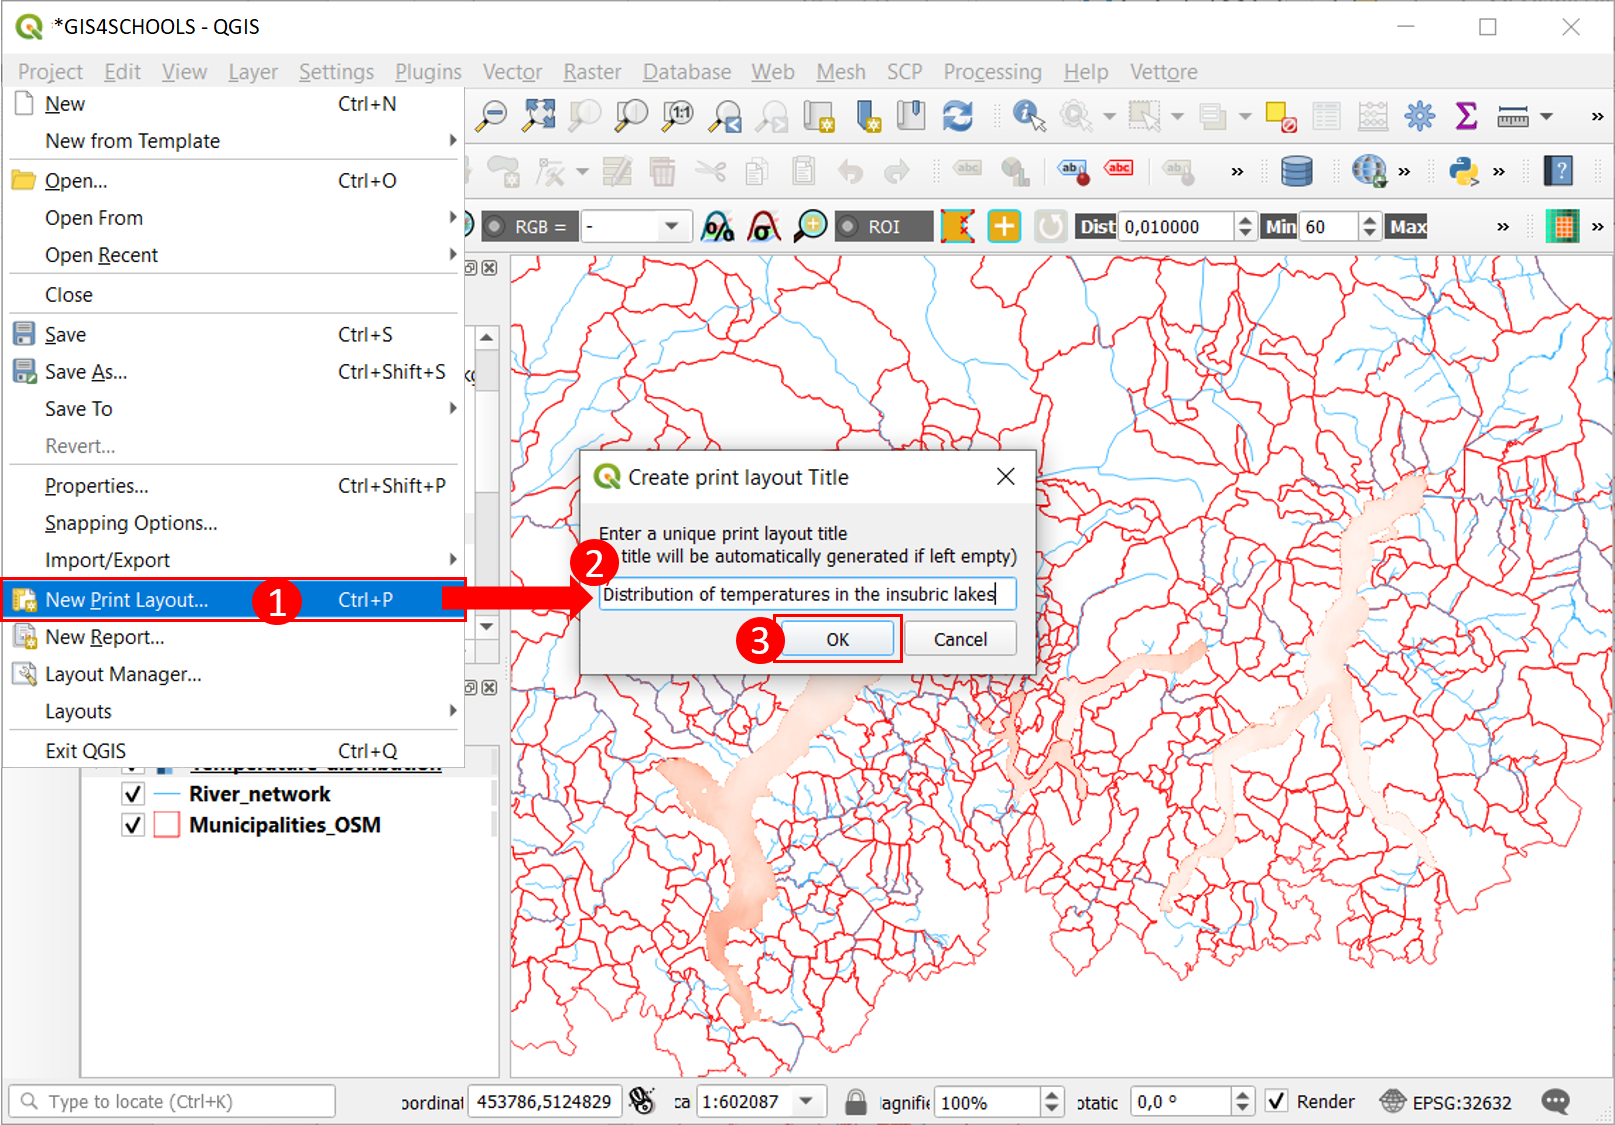
Fig. 1.10.1 – Creation of a New Print Layout.
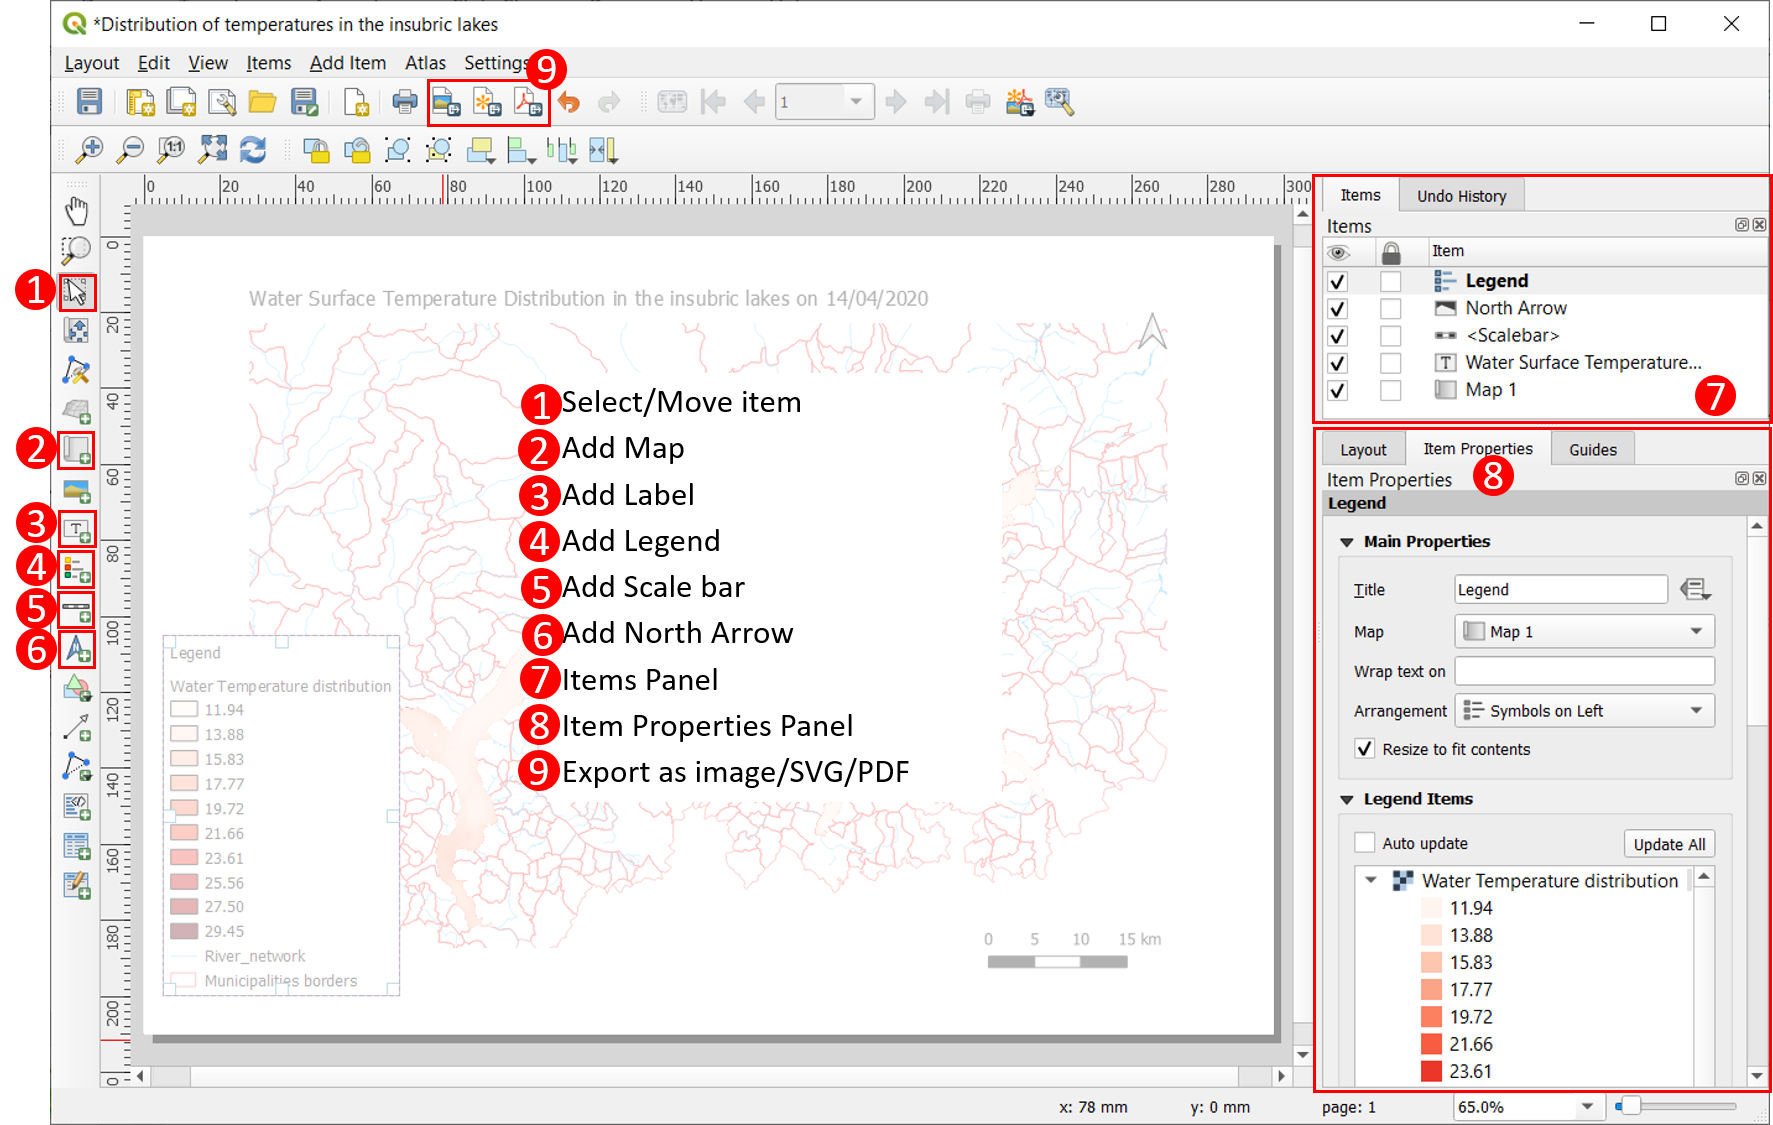
Fig. 1.10.2 – New Print Layout Window, icons and panels.
Title is very important to understand at first sight what a map represents, it should summarize with a few words map purpose, place and time. To add the title to the map click on Add label button (3), decide the position where to place it and click OK to confirm its properties. TTitle position usually should be located on the top of the page, with a huger font with respect to other map items. After having selected the Title item in the Items Panel (7) on the right, Insert the title text (e.g. here it could be “Water Surface Temperature Distribution in the insubric lakes on 14/04/2020”) and set its font in the Item Properties Panel (8).
Click on Add legend button (4), decide its position and accept the default item properties. You will visualize the legend on your map. It is possible to edit the legend, after it has been created, by going on its Item Properties (8), just check, before, to have the Legend item selected in the Items Panel (7). In the Main Properties box you can name the item (here Legend, Fig. 1.10.3, (1)). Then you can focus on legend items: when you add a legend to the map, its different items are represented by default, in the same way they are represented in your QGIS Layers Panel. Therefore, before printing the map, it is usual to change some names, labels or order to make them more understandable. Here, there are two ways: one can make edits directly from QGIS Layer Panels, by modifying the style of layers, or one can also choose to modify them just on the Map Print Layout, leaving the Layers style as it is on QGIS. To apply the second option, it is necessary to uncheck the Auto update box (Fig. 1.10.3, (2)) into the Item Properties Panel. In the Legend items box now it is possible to:
- Reposition the single layers into the Legend, by clicking on the two arrows (Fig. 1.10.3, (3)) below the box.
- Add or remove layers, that are not visible on the map, from the legend (by clicking on + or – , Fig. 1.10.3, (4))
- Change one layer’s name, by double-clicking on the layer’s name, typing a new name and clicking on OK. Here, for example, try to change Temperature_distribution into a clearer ‘Water Temperature Distribution’ (Fig. 1.10.3, (5)) as well as Municipalities_OSM into ‘Municipalities borders’.
- Change the number of decimal digits of temperature values. To do so, click on each numerical label (Fig. 1.10.3, (6)) in the Legend items box and then remove the unnecessary digits, clicking then on OK.
Finally, from Fonts and Text Formatting box (Fig. 1.10.3, (7)), try to change also the font used for the different items in the legend: remember it should be visible but not too huge.
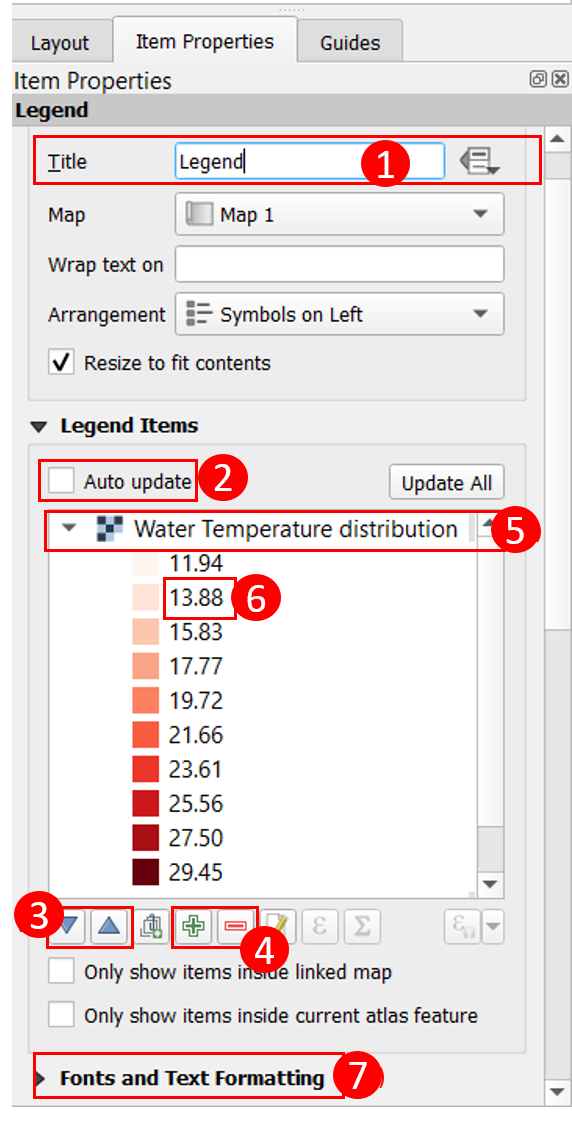
Fig. 1.10.3 – Legend Properties editing.
The map scale allows a map user to properly understand the objects sizes and the distances on the map. To add a scalebar click on Add Scalebar (Fig. 1.10.2, (5)), click on the position where to place it and click OK. Under the Item properties you can change Style or Scale bar units, Label for units, etc. Try to style your scalebar in a way it can be clearly legible as well as useful, by choosing the adequate size and unit of measure. It is possible to replace scalebar by lexical scale (eg. 1:60000) by changing scalebar Style to Numeric. However, use of lexical scale should be limited to those cases where the map is to be printed on paper, otherwise, on a digital document, the scalebar is more appropriate.
Another basic element in a map is the North arrow that helps the viewer with orientation. It can be added on map by clicking on the Add North arrow icon (Fig. 1.10.2, (6)), clicking on the position where to place it, and clicking on OK then.
Try to create a well-balanced map, clear and effective and try to size and locate each element according to its importance. When in the end you are satisfied with the map layout, you can export it as PDF, image or SVG File. In every case, just click on one of the Export as… buttons (Fig. 1.10.2, 9), choose the folder where you want to save the map, name it, or just leave the one you gave at the beginning (‘Distribution of temperatures in insubric lakes’). Click on Save to open the Export Options window where it will be possible to define Export resolution, Page width or height and also to Crop page to content if some parts of it are empty (5). You can keep all the default settings and click on Save: the map will be finally complete and saved on your PC. Fig. 1.10.4 shows an example of a possible final print layout.
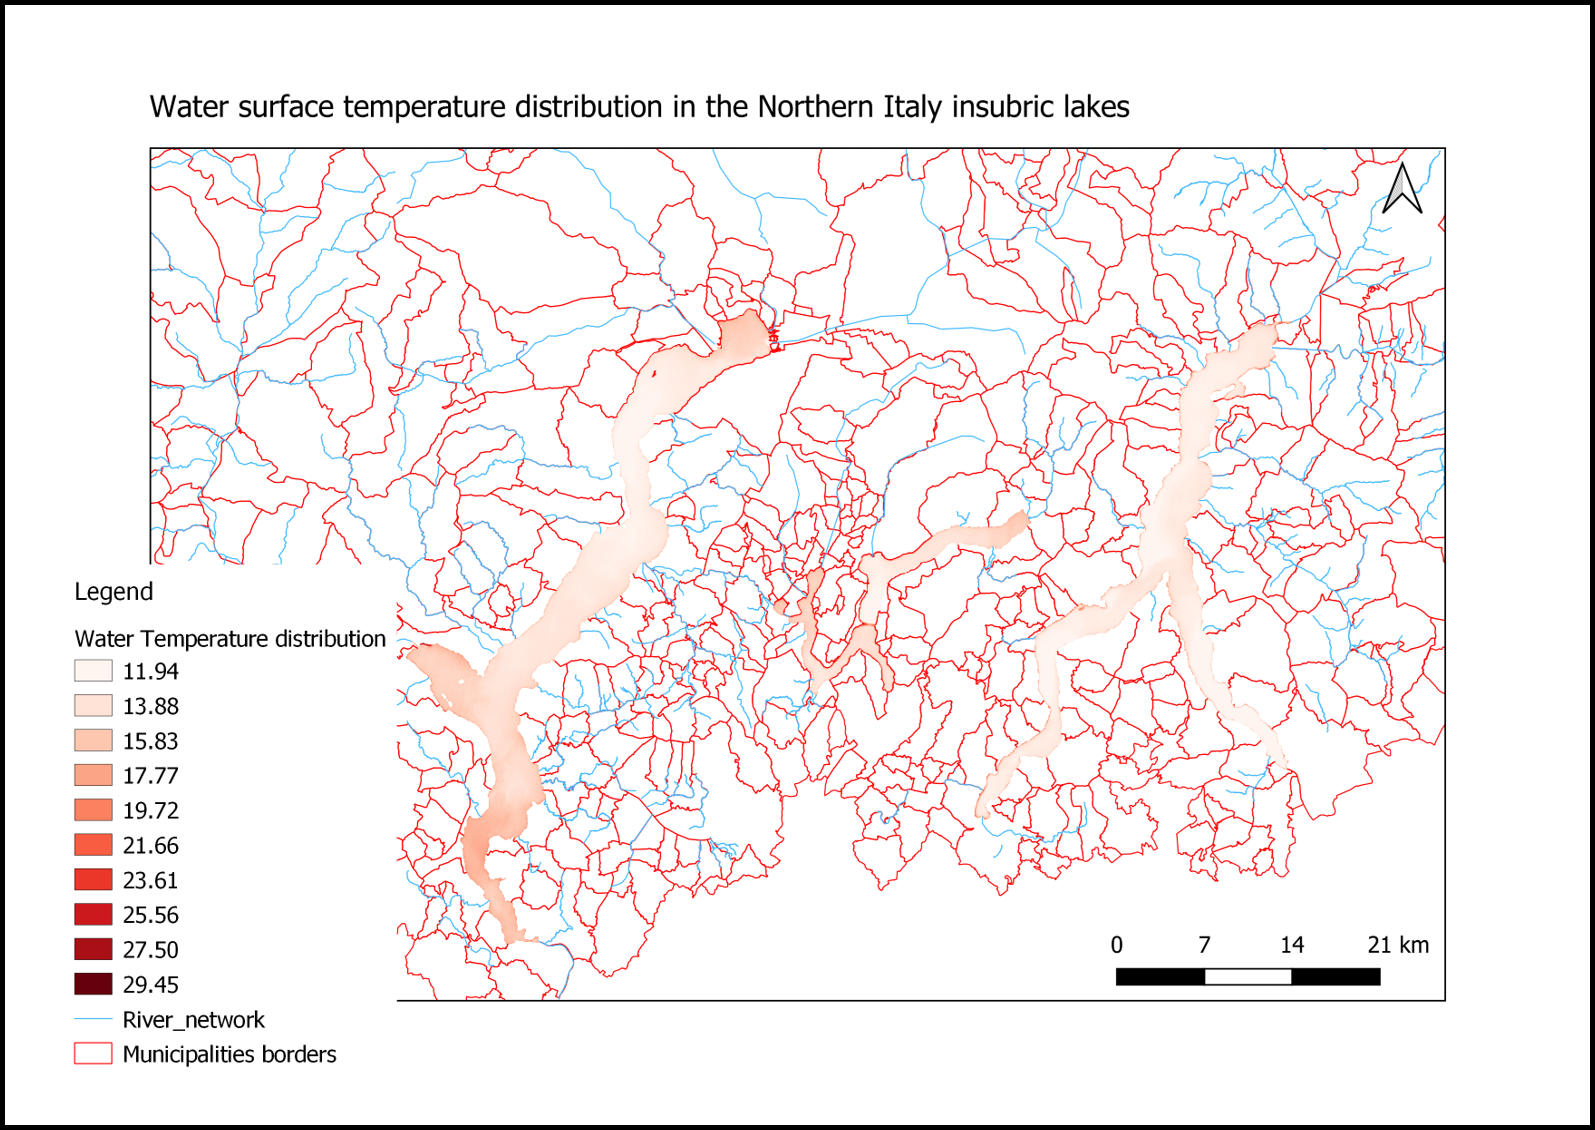
Fig. 1.10.4 – The final print out map.