1.2. Coordinate reference Systems
The main difference between GIS and other information systems is that they explicitly involve coordinates which define the location, shape, and extent of spatial data. Geographic location is the element that distinguishes spatial data from all other types of information, so methods for specifying locations on the Earth’s surface are essential to GIS [2]. Many techniques have been developed over the centuries, but only thanks to GIS it has become possible to automatically switch from one to another. Nevertheless, to understand GIS and spatial data we must have in mind how coordinate reference systems (CRS) are established for the Earth and how coordinates are measured on the Earth’s surface.
Coordinates are sets of numbers that unequivocally define locations but each of these values is “unique” to any given point only for a specified set of measurements and calculation assumptions, that is the CRS. To define the location of something during maths or physics classes, for example, you often use a coordinate system. In these cases, you have likely used a two-dimensional Cartesian coordinate system which consists of a pair of perpendicular ordered axes, associated with a unit of length and orientation. The point where the axes meet is generally called origin, while the horizontal and vertical axes are called respectively X and Y. The coordinates of a point (x, y) are expressed as its Euclidean distance from the X-axis and the Y-axis. Concerning CRS in GIS, we have to consider that we live in a three-dimensional and curved space. To define the location of objects on the Earth we need a coordinate system that adapts to its shape, therefore a geographic coordinate system.
A geographic coordinate system is a three-dimensional reference system used to locate points on the Earth’s surface, and it is based on the Earth’s rotation around its center of mass and the gravity force. The center of mass lies on the Earth’s rotation axis and the plane crossing the center of mass, perpendicular to the rotation axis, defines the Equator. Each point in the geographic coordinate system has two coordinate values: latitude and longitude (Fig. 1.2.1). The latitude and longitude measure angles and their unit of measure is usually the decimal degree. Latitude and longitude are often symbolized respectively by the Greek letters phi (φ) and lambda (𝜆).
The latitude of a point is defined as the angle formed by the intersection of a line perpendicular to the Earth’s reference surface at the point, and the plane of the Equator. Points north of the Equator have positive latitude values, while points south have negative values. Latitude values range from -90 to +90 degrees. Lines of latitude are also called “parallels” because a particular value of latitude forms a circle parallel to the Equator.
The longitude value is defined by the angle between the plain crossing the North and South poles and a reference plane. Lines of constant longitude are termed “meridians” and the reference plane is identified by the prime meridian which is traditionally recognized with the meridian passing through Greenwich (United Kingdom). Longitude values range from -180 to +180 degrees.
The definition of latitude and longitude requires knowing about the Earth’s shape to materialize parallels and meridians on the actual Earth’s surface and compute the angles. A modelled version of the Earth’s surface is called geodetic datum. The best description of Earth’s shape is provided by the geoid which results from complex physical models and describes the surface of equal gravity formed by the oceans, and its extension under the continents. For traditional GIS application, the geoid can be approximated using a sphere or, better, an ellipsoid of rotation. A lot of effort was spent over the past centuries in finding an ellipsoid that approximates the shape of the Earth. As a result, many different ellipsoids have been defined according to their application at a local or global scale. The ellipsoid known as WGS84 (the World Geodetic System of 1984) is currently the most widely accepted global geodetic datum and it is the one used, for example, by the Global Positioning System (GPS). Once the geodetic datum is defined, the orthometric height of a point, that is the vertical distance between the point and the geoid model, can be also computed.

Fig. 1.2.1 – Schematic of geographic coordinates system. The geographic coordinates of point p are defined by the angles φ (latitude) and λ (longitude)
1.2.1. Projections
Representing geographic information and maps on flat surfaces (monitors or paper) requires transforming locations from the Earth’s curved surface to two-dimensional locations on a flat Cartesian plane. This can be accomplished using mathematical methods known as projections.
To understand the practical meaning of map projections, let’s imagine placing a light inside a transparent globe on which opaque Earth features are placed. Then wrap the globe in a flat surface (a two-dimensional piece of paper) and draw there the feature outlines. By unwrapping the flat surface you would see the original curved features reproduced on a plane, that is actually their projection. Different types of projection can be performed by wrapping the globe with surfaces of different shapes (Fig. 1.2.1).
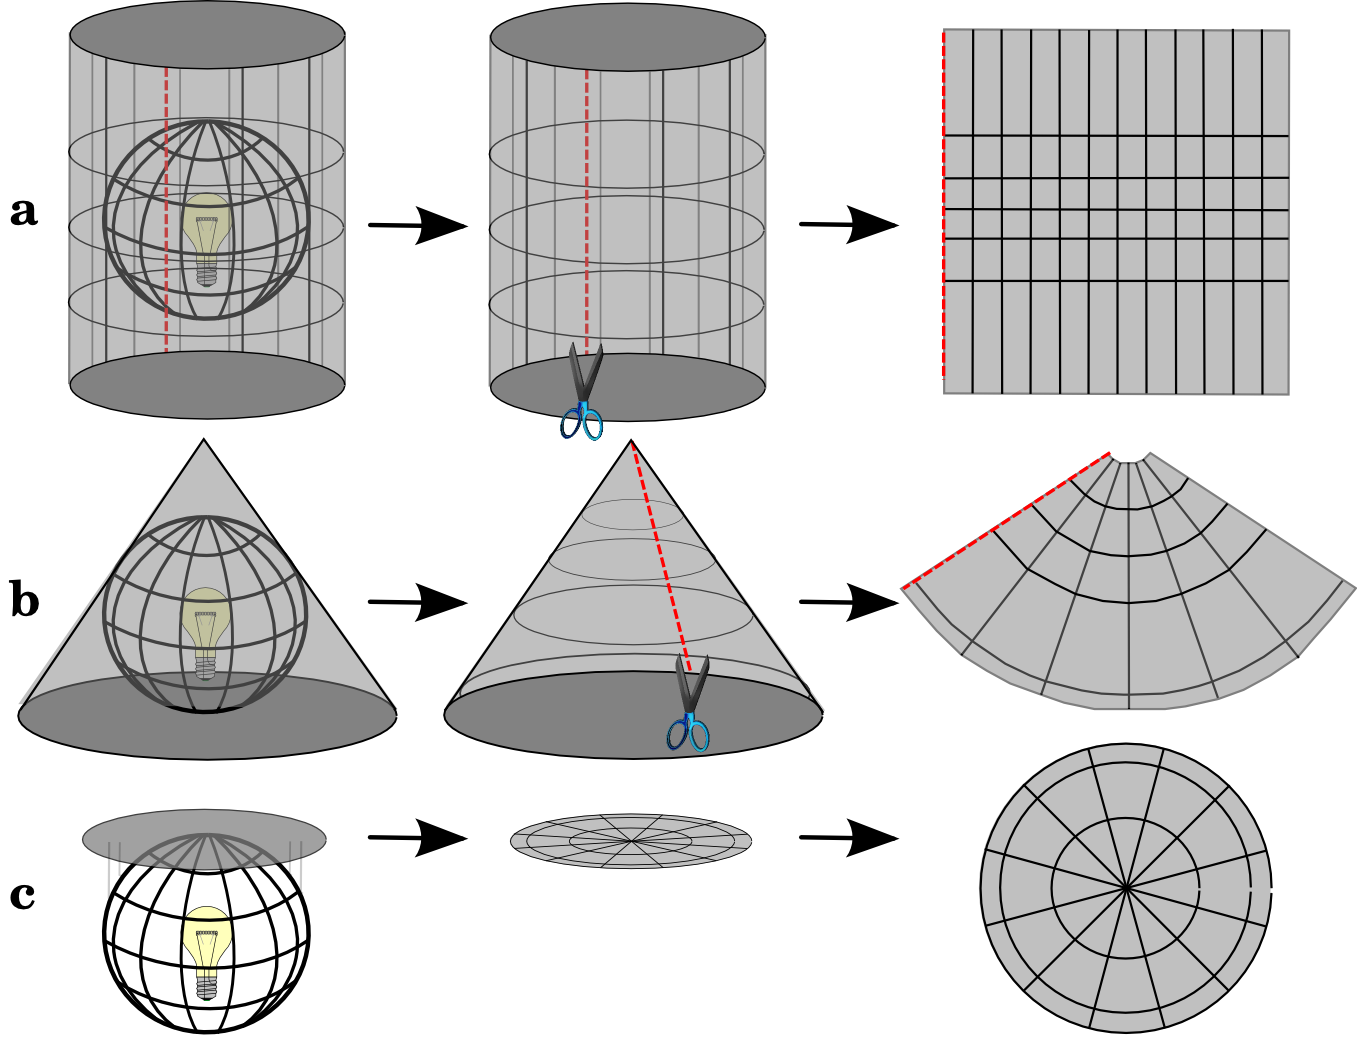
Fig. 1.2.1.1 – Most popular map projections are performed by using a) cylindrical, b) conical or c) planar projection surfaces. Source: https://qgis.org
The ultimate goal of map projections is to convert longitude and latitude to x and y Cartesian coordinates so that calculations of distance and area can be performed in terms of metric units. The x coordinate is usually the eastward direction of a point, and the y coordinate is usually the northward direction of a point. The centre line that runs east and west represents the X-axis, and the centre line that runs north and south represents the Y-axis. Together with the datum and the unit of measure, the information on projection is core to the definition of the CRS. If a projection is defined for a spatial dataset it means that a projected coordinate system is being used.
A flat map always distorts geometry in some way because the Earth is curved. If we would plot latitude and longitude coordinates directly on a Cartesian system, straight lines would appear bent and polygons distorted. This distortion (Fig. 1.2.1.2) may be difficult to detect on detailed maps that cover small areas, but they become visible as the mapped area increases. The best projection for a map depends on the scale of the map and on the purposes for which it will be used. A projection may have unacceptable distortions if used to map the entire European continent, but may be an excellent choice for a large-scale (detailed) map of your city. Considering map purposes, projections have to be carefully selected according to which geometric properties are preserved (or distorted) by the considered transformation. Map projections can be therefore classified according to these properties:
- Conformal projections preserve local shape by maintaining the same scale in any direction for any map location. Meridians and parallels intersect at right angles. This is accomplished by maintaining all angles. The disadvantage of this is that surface area may be greatly distorted. A popular example of conformal map projection is the Mercator projection.
- Equal-area projections preserve the area of displayed features; so all mapped areas have the same proportional relationship to the areas they represent on the Earth. This is achieved by distorting the other spatial properties of shape, angle, and scale. In equal-area projections, the meridians and parallels may not intersect at right angles. A popular example of equal-area map projection is the Mollweide projection.
Conformal and equal-area projections are the most popular and mainly adopted in GIS. Other types of projections are also available such as the equidistant projections that preserve the distances between points, and the true-distance projections which correctly portray angular directions with respect to the map center.
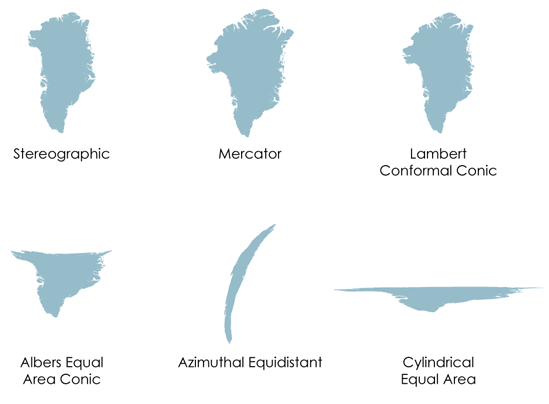
Fig. 1.2.1.2 – Distortions of Greenland area from different sample map projections. Source: https://www.axismaps.com
1.2.2. EPSG
Many CRS and projections have been developed in the history of cartography. The power of GIS is that they allow converting any spatial dataset between different CRS and projections in an automatic way. To do so, the availability of digital catalogues containing encoded parameters (such as units, datums and projection formulas) of the different CRS is of primary importance. The most popular catalogue is the EPSG Geodetic Parameter Dataset which is a database of CRS information maintained by the International Association of Oil and Gas Producers. This dataset contains both CRS definitions and information on how to safely convert data from one CRS to another that are directly integrated into GIS software. Using EPSG is easy as every CRS has a unique integer identifier. For example, the geographic coordinate system based on the WGS84 is identified by the EPSG code 4326.
| [2] | Longley, P. A., Goodchild, M. F., Maguire, D. J., & Rhind, D. W. (2015). Geographic information science and systems. John Wiley & Sons. |